RAISINS!
It all began with a simple idea: to make data analysis accessible, accurate, and stress-free for the agricultural research community. Back in 2020, we introduced GRAPES (General R-based Analysis Platform Empowered by Statistics) www.kaugrapes.com a humble, R shiny -based tool designed for the students and researchers of Kerala Agricultural University. Little did we know then, it would grow into a trusted companion for more than 200,000 users worldwide and earn citations in over 150 indexed journals.
But growth brings new challenges. GRAPES, originally tailored for local use, struggled to keep pace with the scale and expectations of a global audience. We knew we needed to build something more robust, something that could not just meet, but anticipate the needs of modern agricultural research.
That dream took shape in 2024, when a spirited team of young statisticians came together to form STATOBERRY LLP, under the mentorship of Dr. Pratheesh P. Gopinath, Head of the Department of Agricultural Statistics, College of Agriculture, Vellayani. From this dynamic collaboration emerged online web application for reseacrh data analysis in agriculture RAISINS-R and AI Solutions in INferential Statistics. RAISINS can be accessed at www.raisins.live
RAISINS is not just another software. It is a complete ecosystem that brings together the power of R, Python, and AI in a seamless, point-and-click interface. Whether you’re working on design of experiments, social science surveys, or advanced statistical genetics, RAISINS simplifies the process, automates best practices, and delivers publication-ready results without requiring you to write a single line of code.
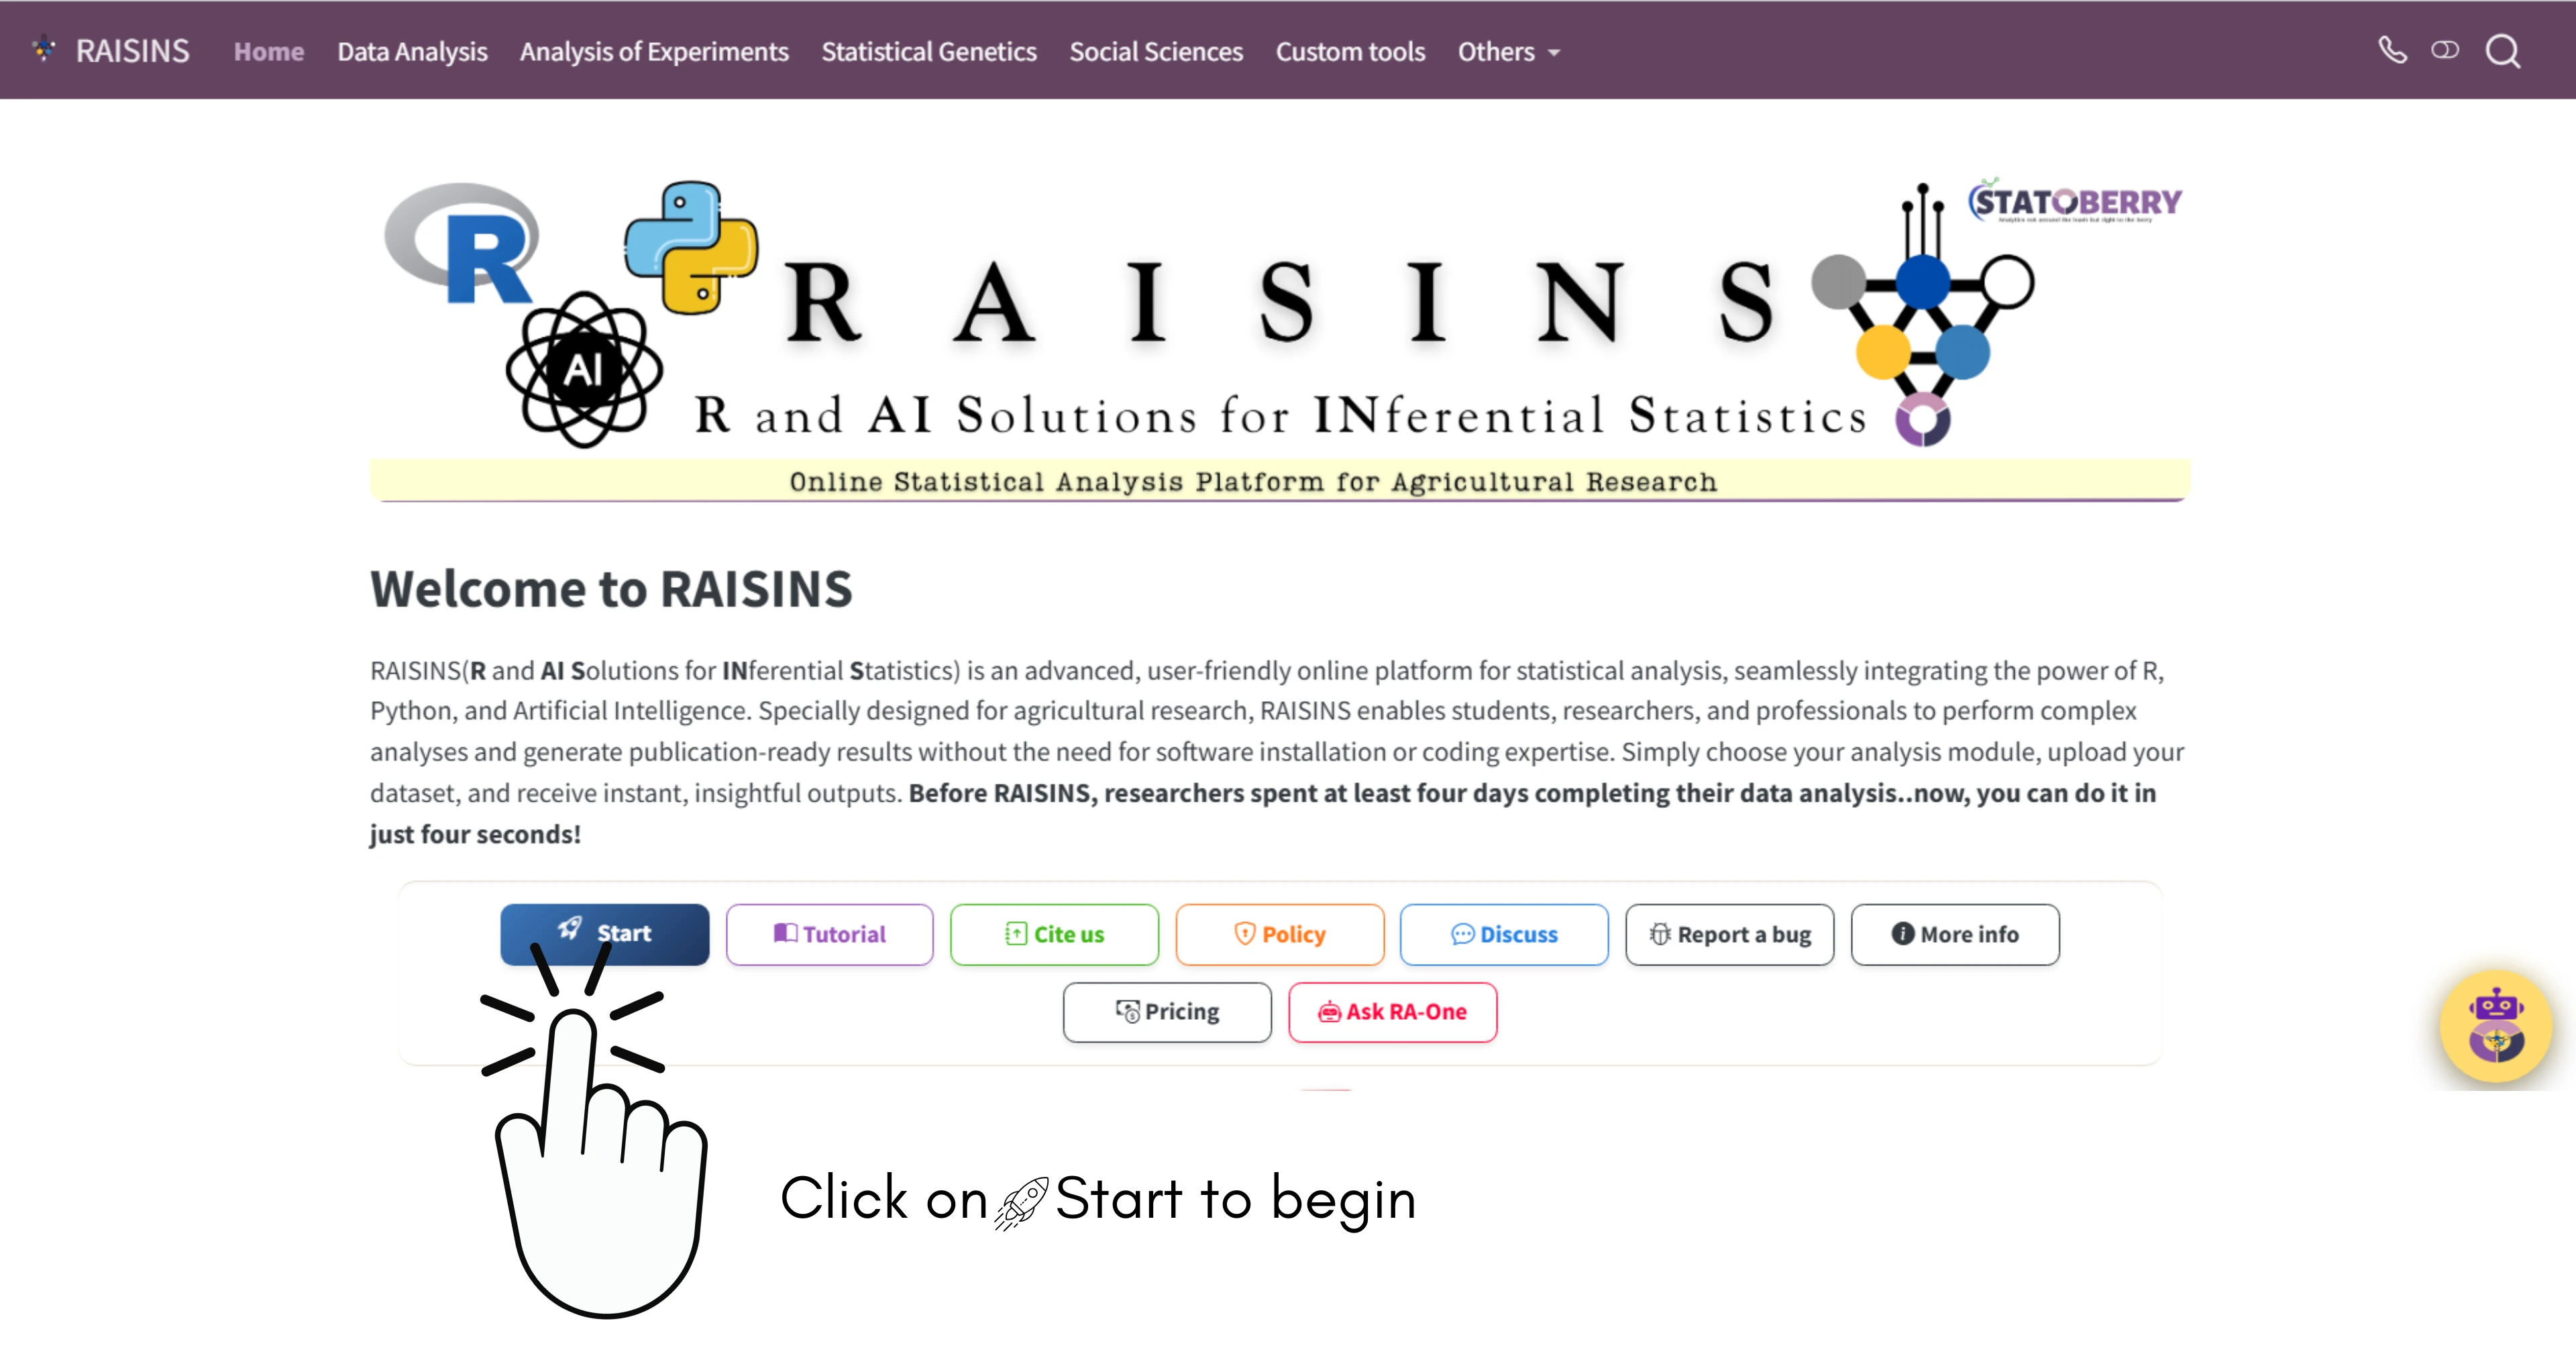
Getting started
Click on Start in the home page of RAISINS as shown in Figure 1 or simply scroll down
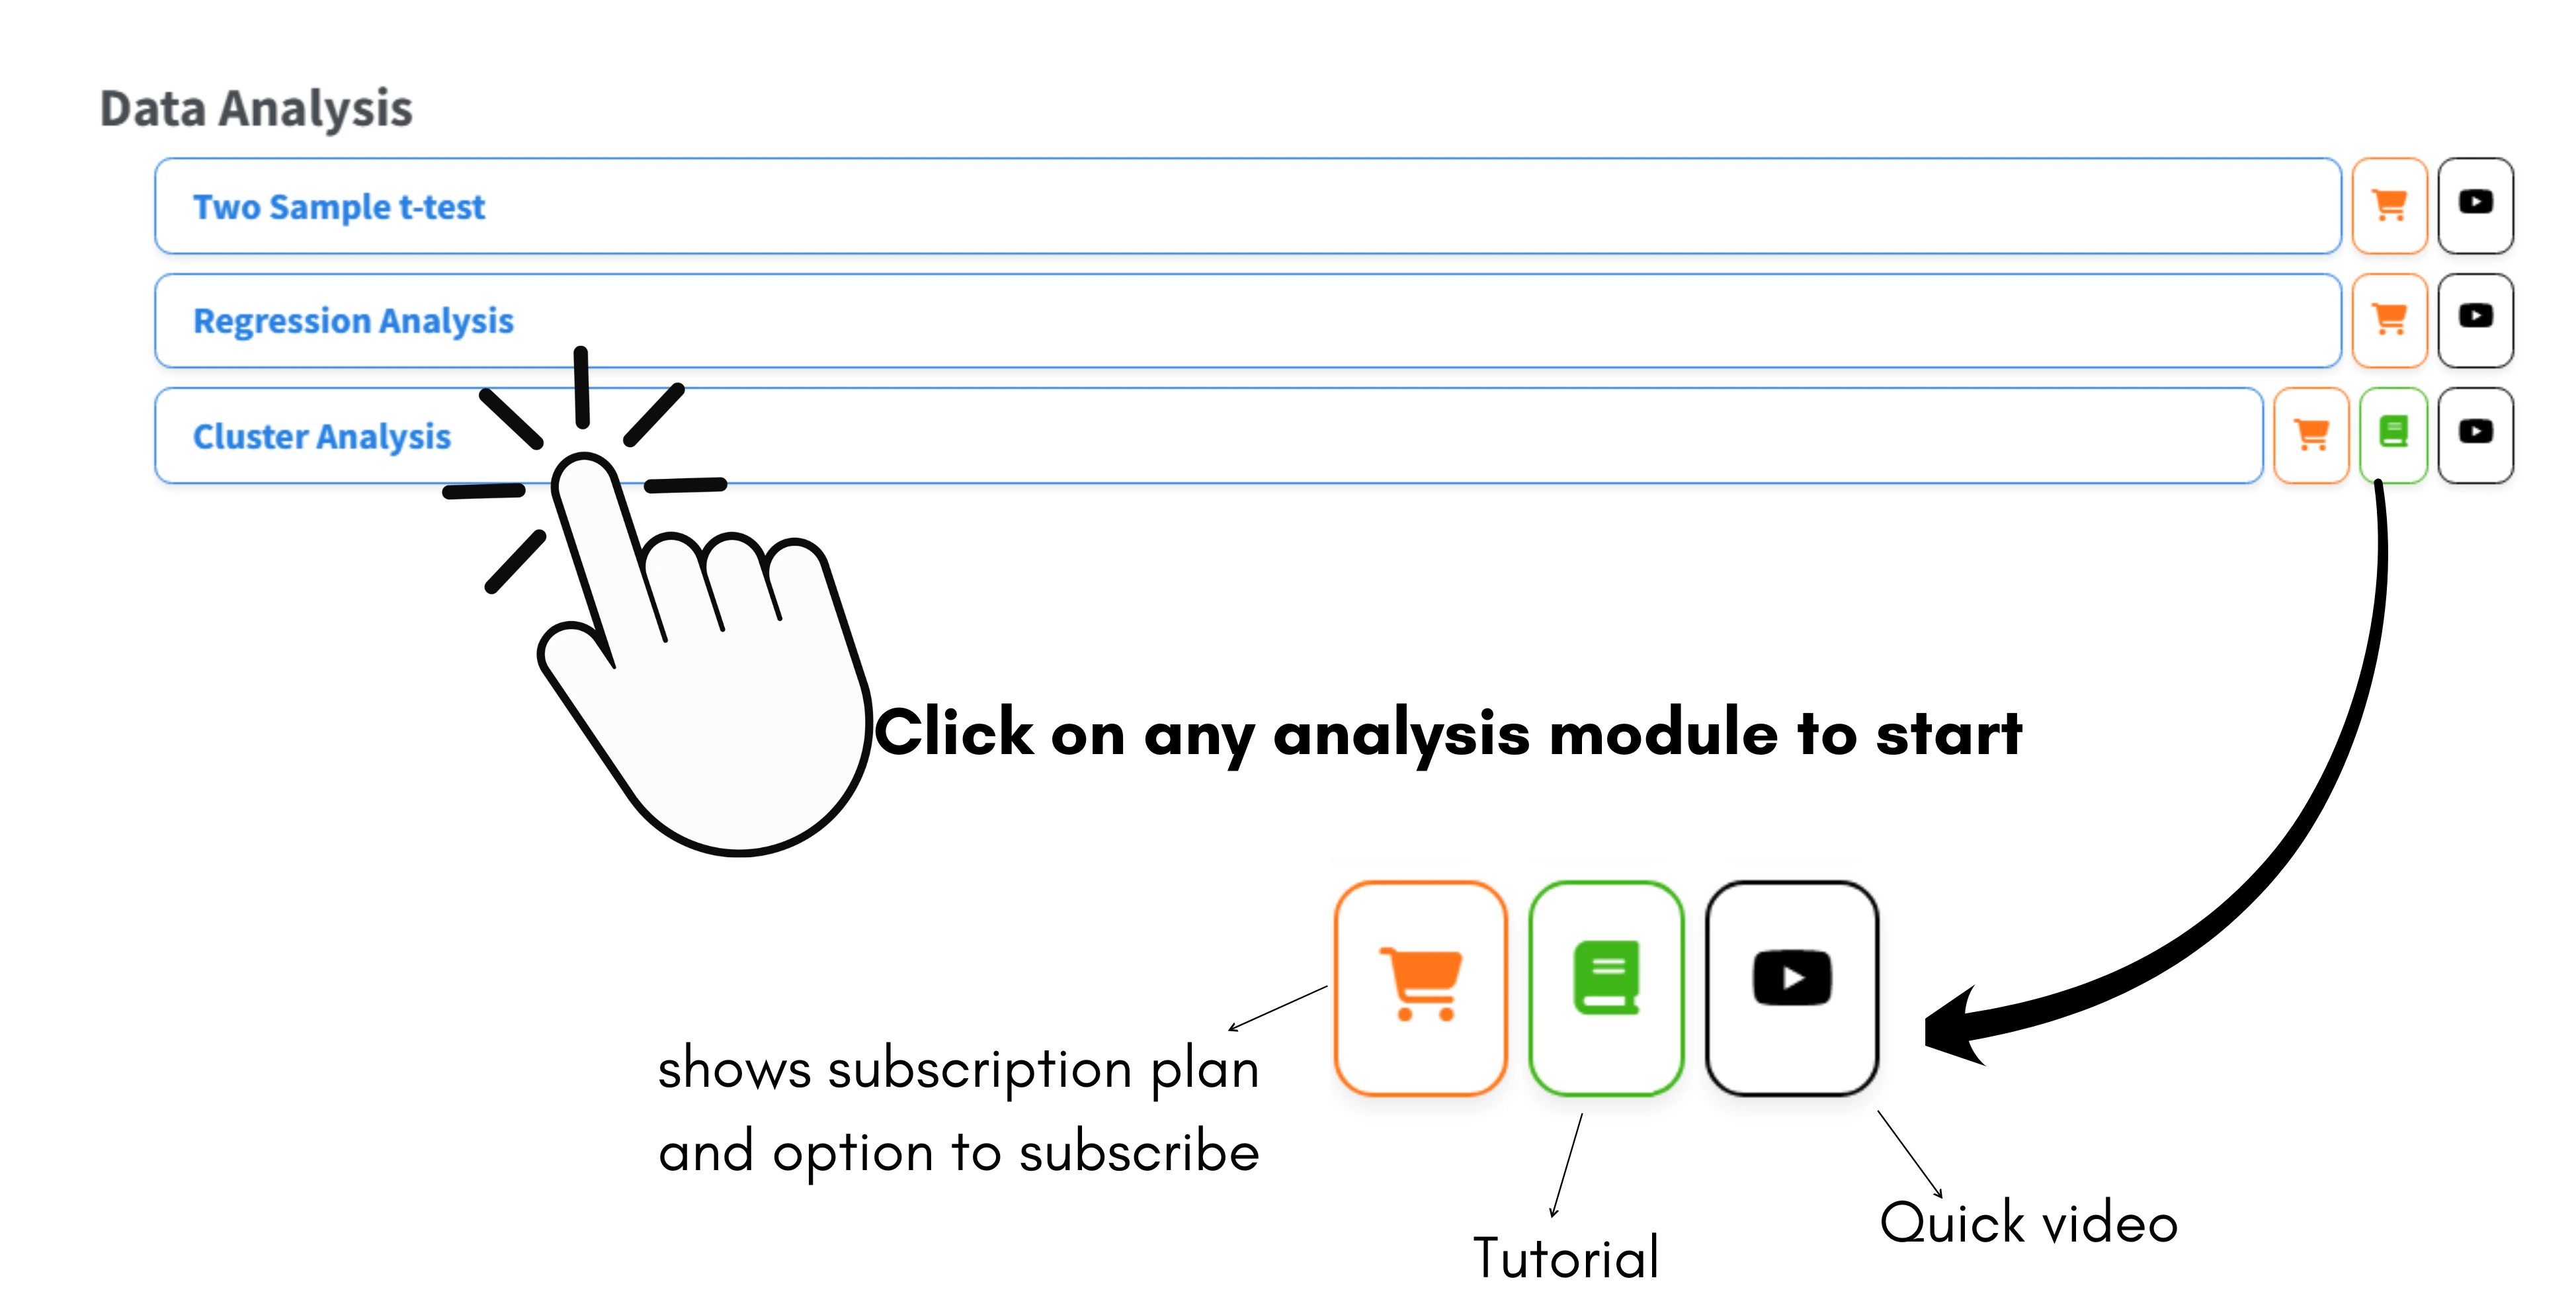
- You will be taken to the list of available modules in RAISINS under the Data Analysis section, as shown in Figure 2. Click on any module to get started. Each module is self-contained and covers every aspect of its respective analysis from data input to interpretation. All RAISINS modules follow a consistent layout and workflow, making it easy for users to navigate and perform different analyses without having to learn each one separately.
What is a module?
In RAISINS, each complete analytical tool or statistical application such as t-test, Regression Analysis, or CRD is presented as a separate, self-contained application, which can be accessed indvidually. These individual applications are referred to as modules.
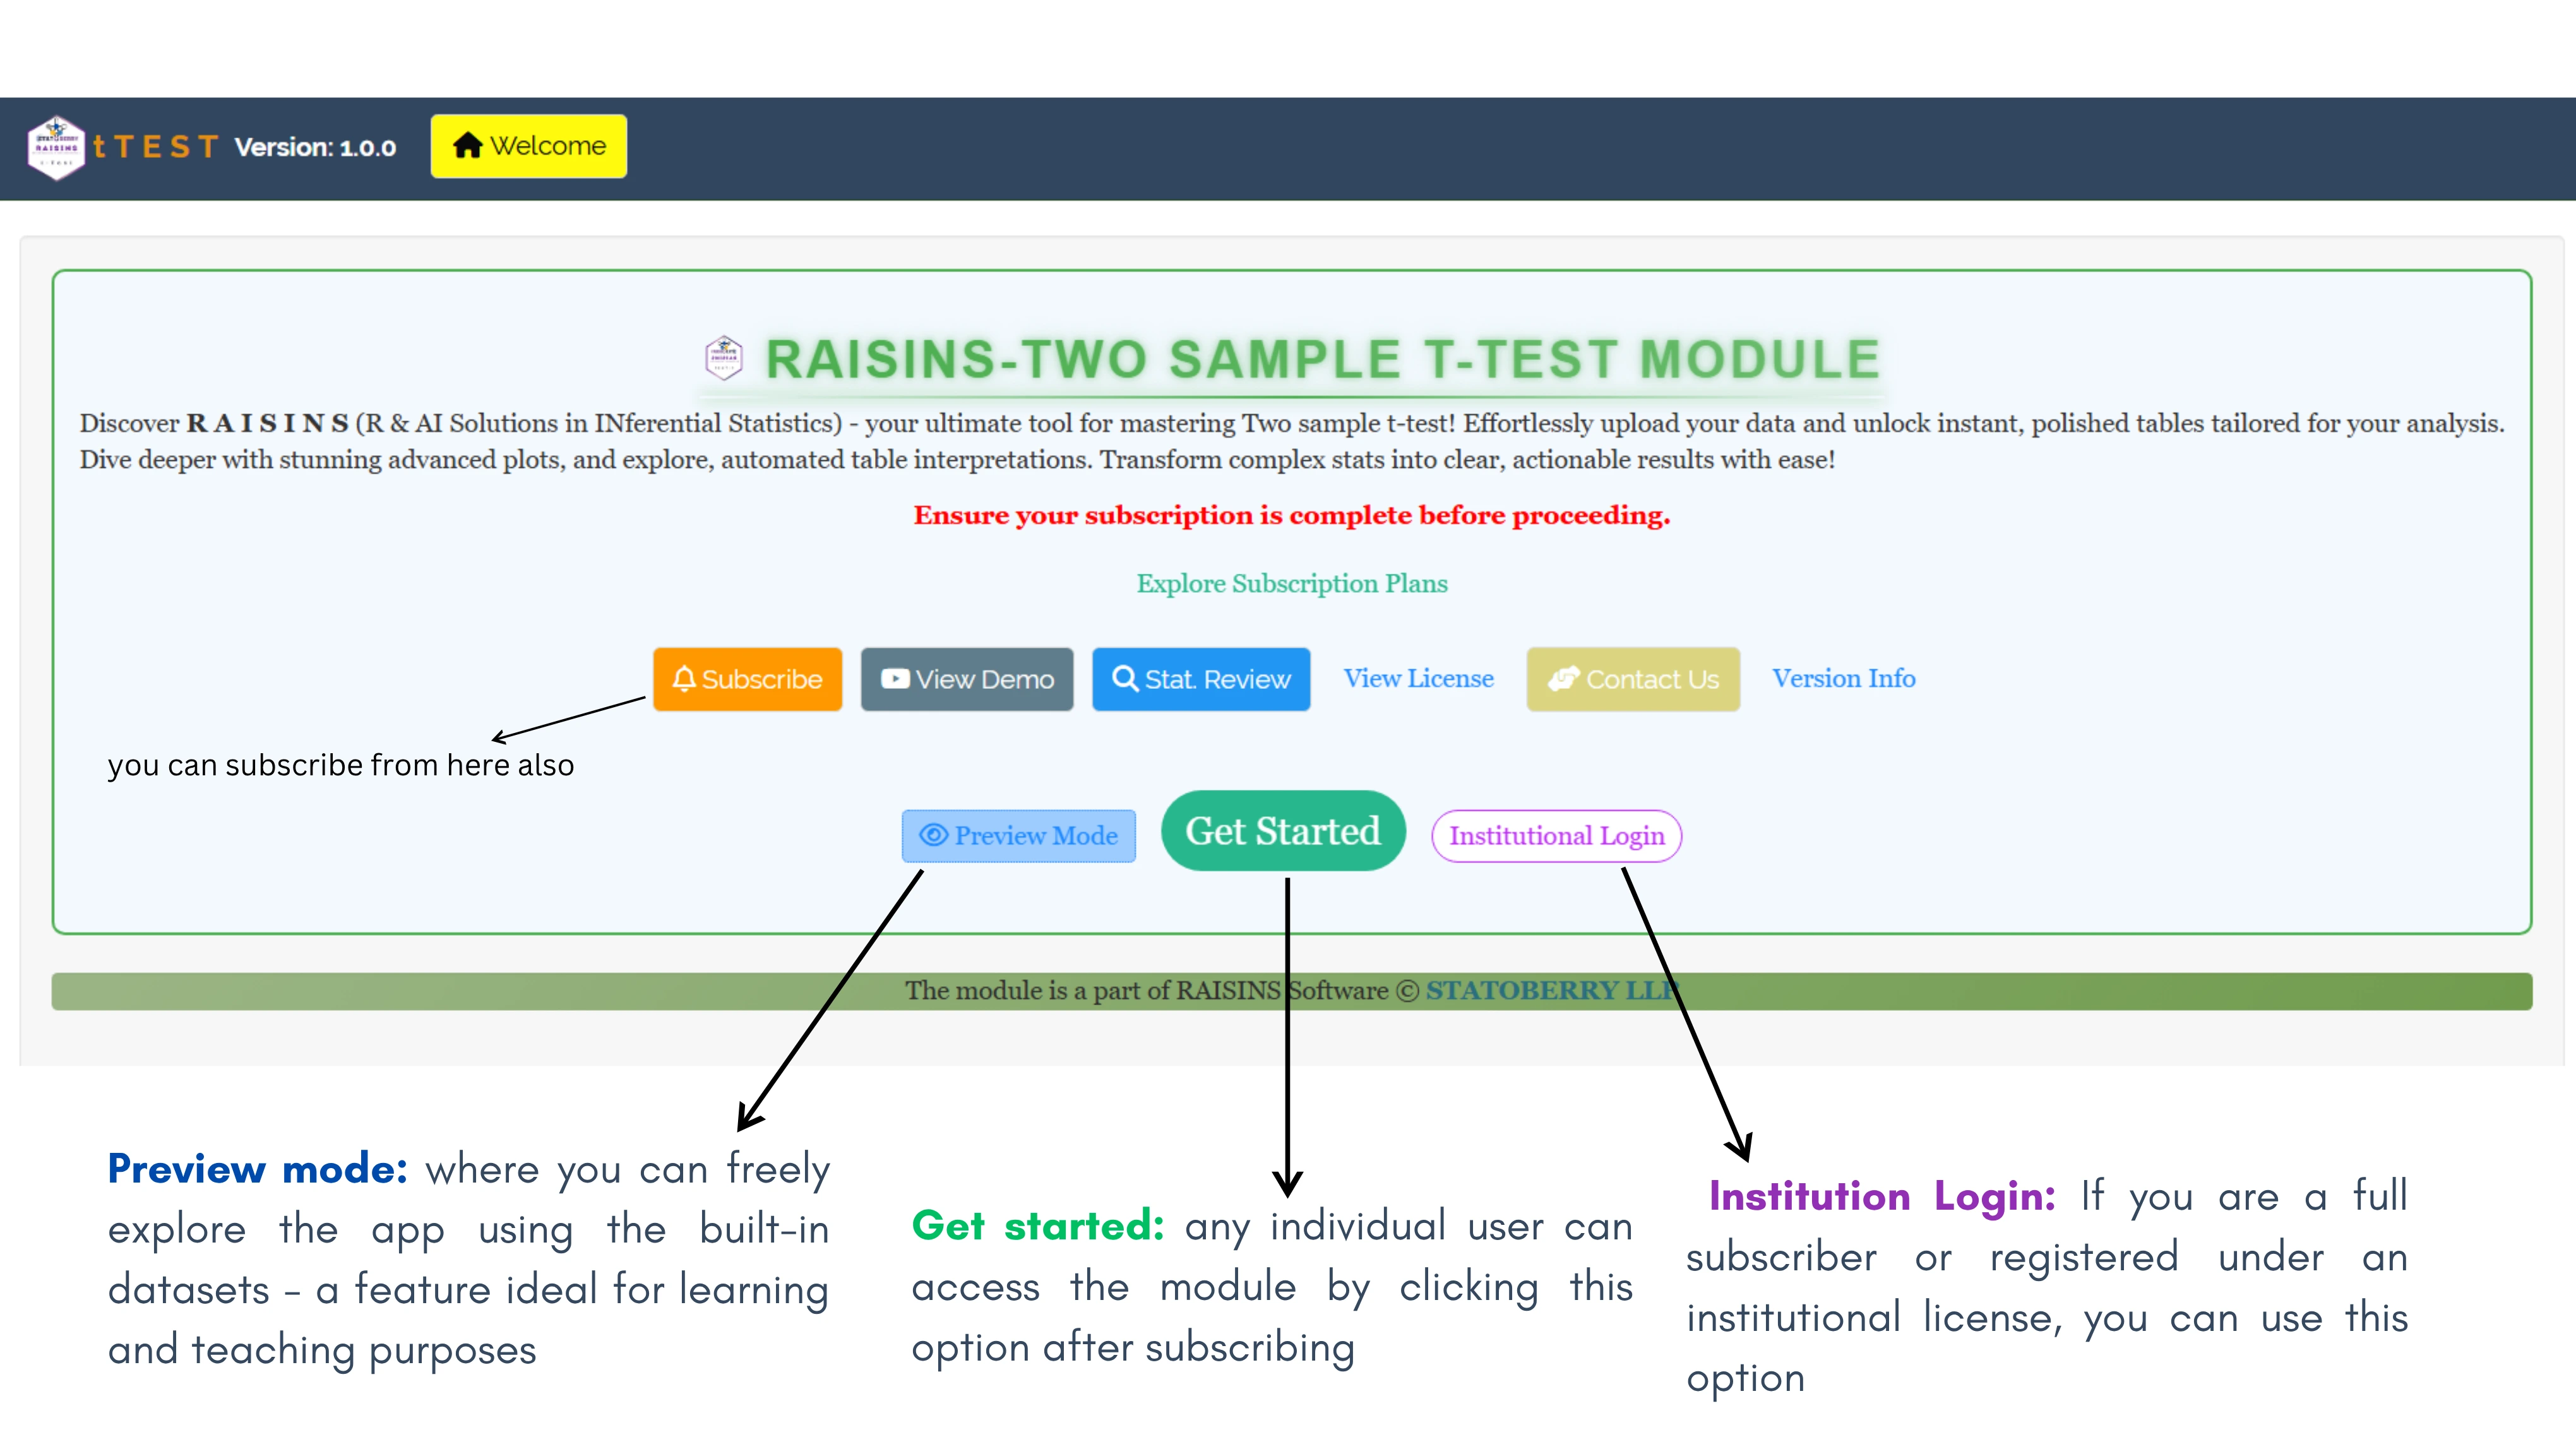
- Clicking on any analysis module will open up a window like that shown in Figure 3. Each module has three login options.
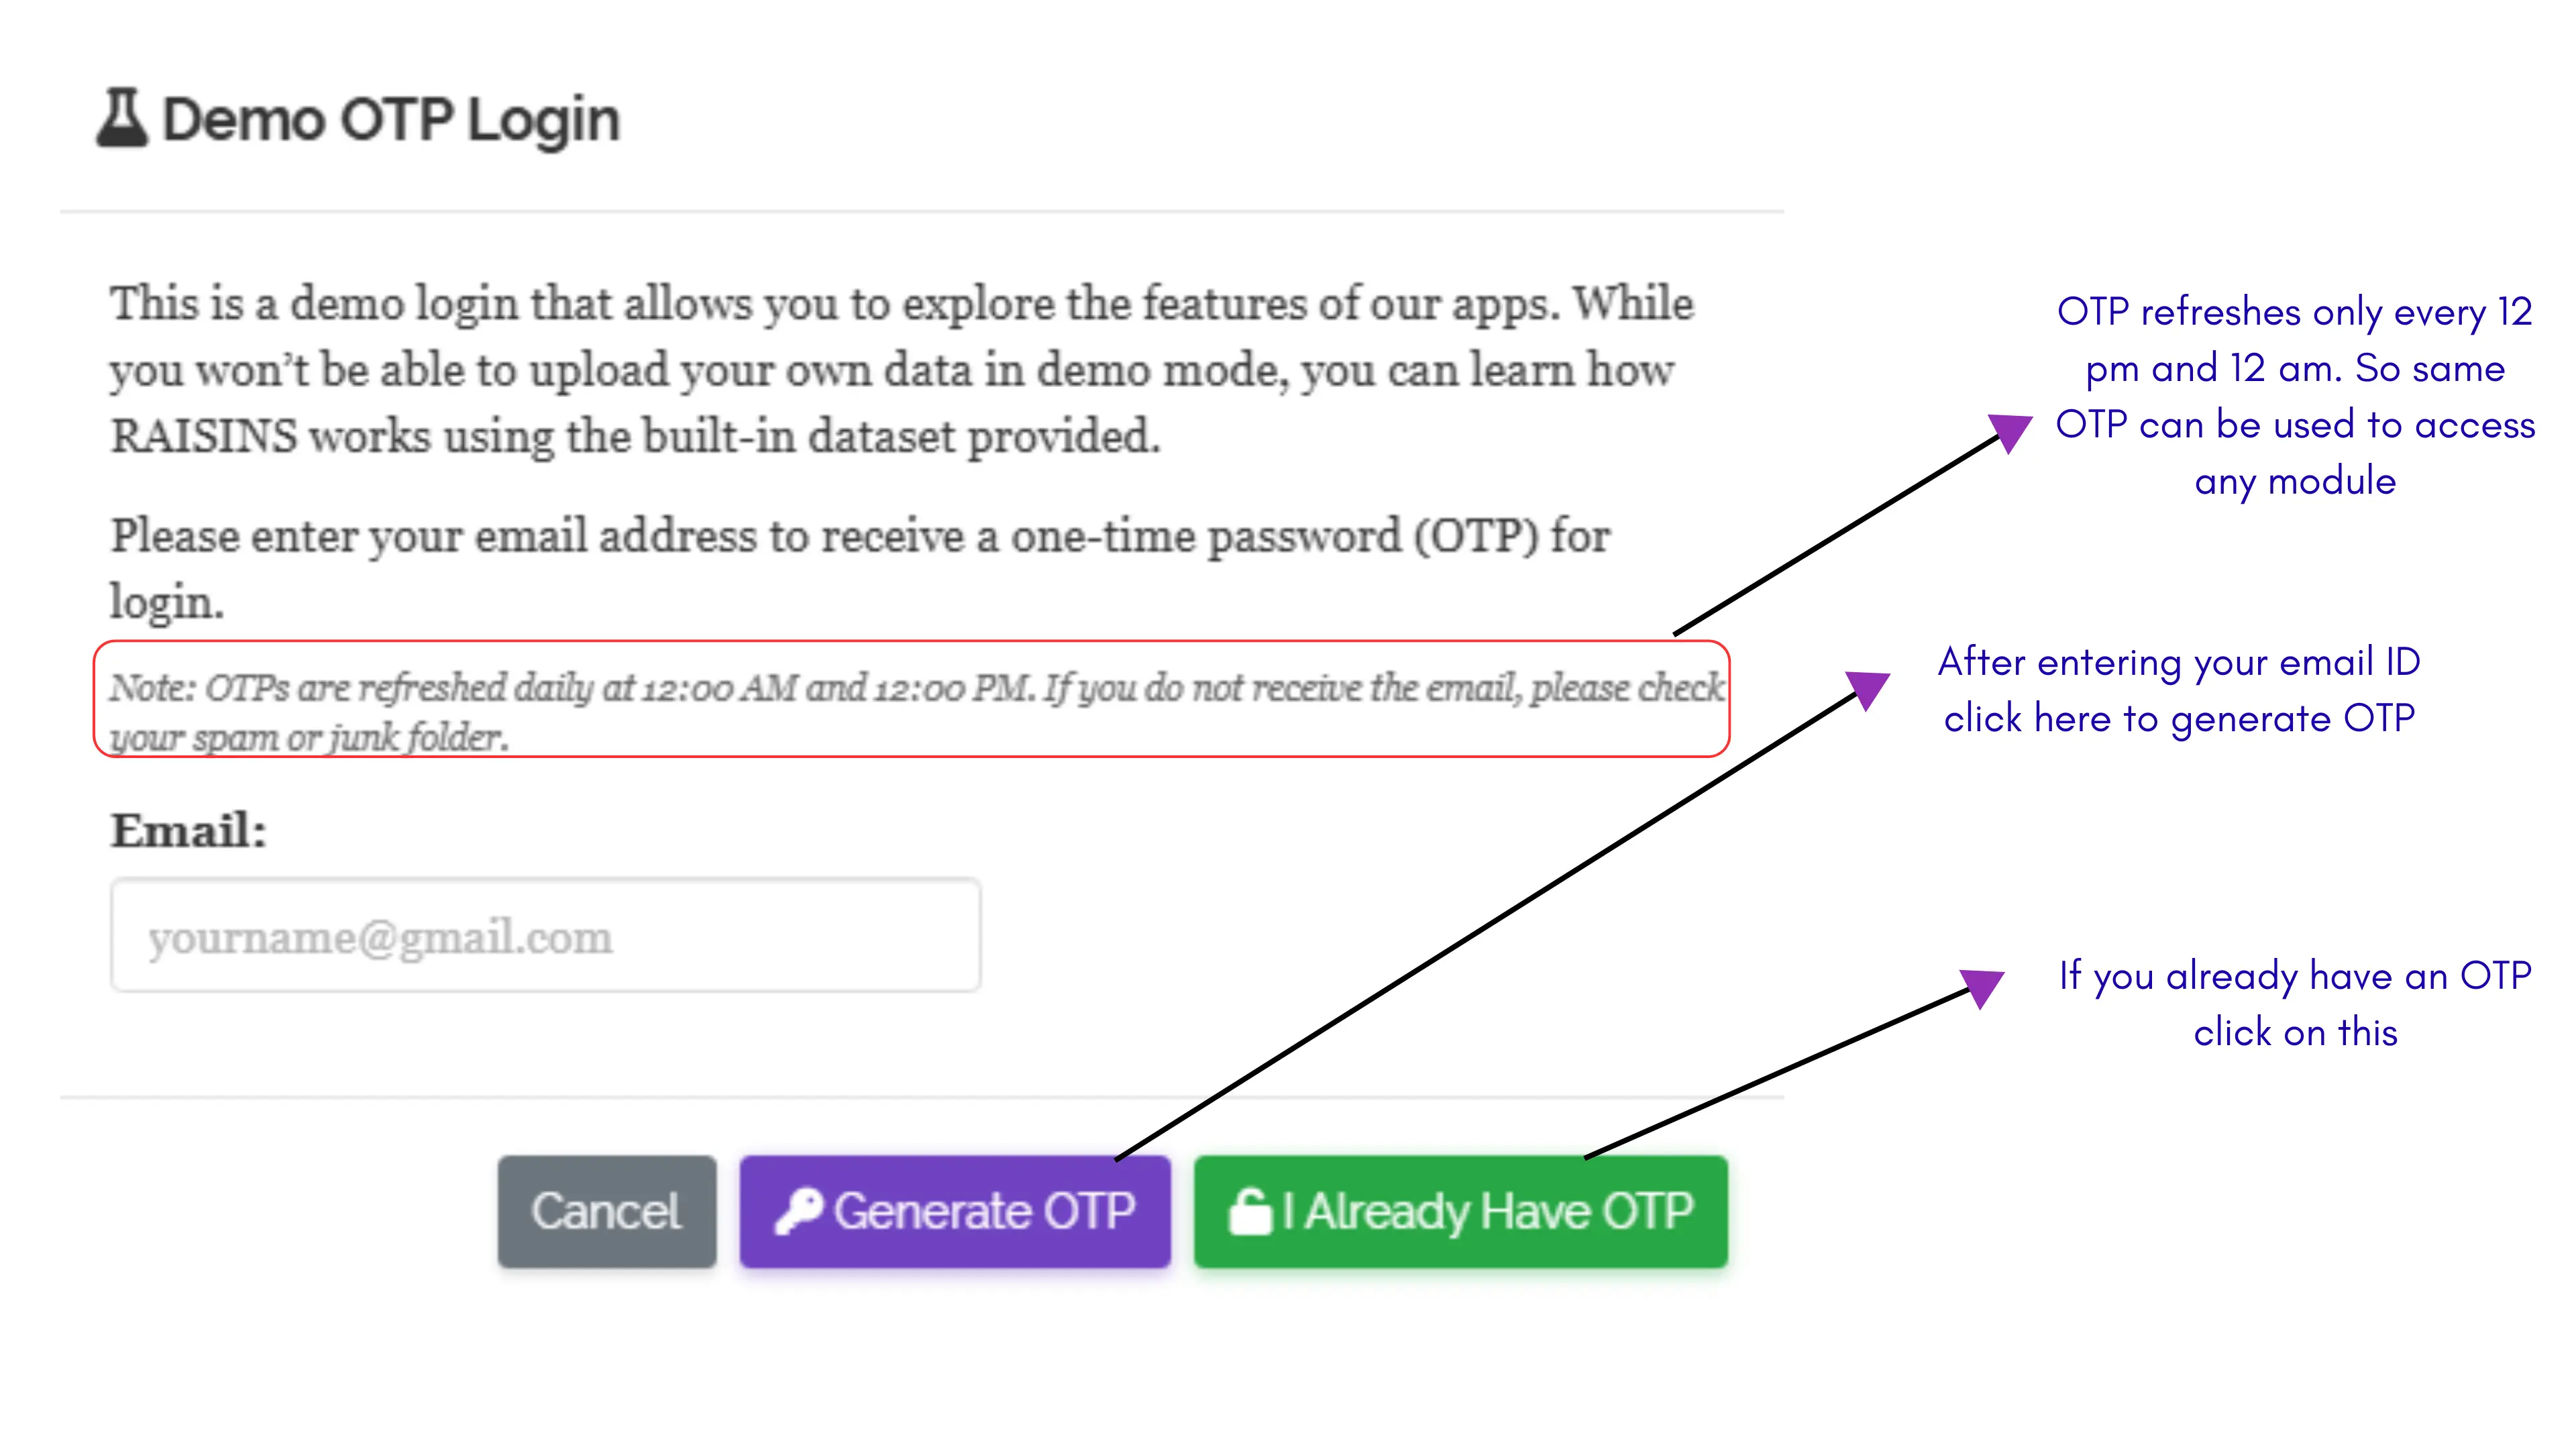
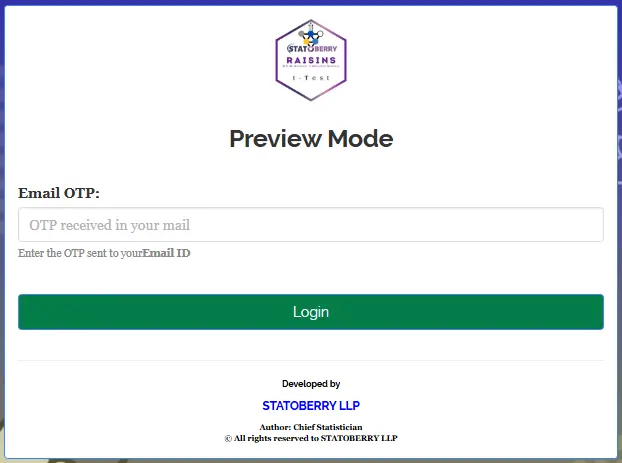
Preview Mode: Before subscribing to any module, you can explore RAISINS using the preview mode. Simply enter your email ID, and an OTP will be sent to your inbox. Use this OTP to log in and test any module with the built-in sample datasets. For your convenience, the OTP generated for your account remains valid until it refreshes at 12 a.m. and 12 p.m. (IST). This means you can revisit and explore multiple modules within that time window using the same OTP, without needing to generate a new one. Preview mode is an excellent feature for teaching, demonstrations, and learning how RAISINS works before making a subscription.
Get Started: This is the primary login option for users who have subscribed to any RAISINS module. Simply log in using your registered email ID and the password you created during registration. Once logged in, you can upload your own datasets, and begin your analysis seamlessly.
Institutional Login: If you are subscribed to all RAISINS modules through the Unlimited Plan or have access via an institutional license, you can log in using this option. An OTP will be sent to your registered email ID, which you can use to log in. Like in preview mode the OTP generated for your account remains valid until it refreshes at 12 a.m. and 12 p.m. (IST) and can be used to access all the modules included in your institutional plan.
All OTPs generated in RAISINS are refreshed only at 12 a.m. and 12 p.m. (IST) You don’t need to generate a new OTP each time — the same OTP can be used to access any module until the next refresh, for both Preview Mode and Institutional Login.
- If you are a beginner, you might sometimes feel unsure about which analysis tool to choose or what tool is best for your data and research. That’s exactly where a statistician’s guidance becomes valuable and RAISINS offers you three simple ways to get it.
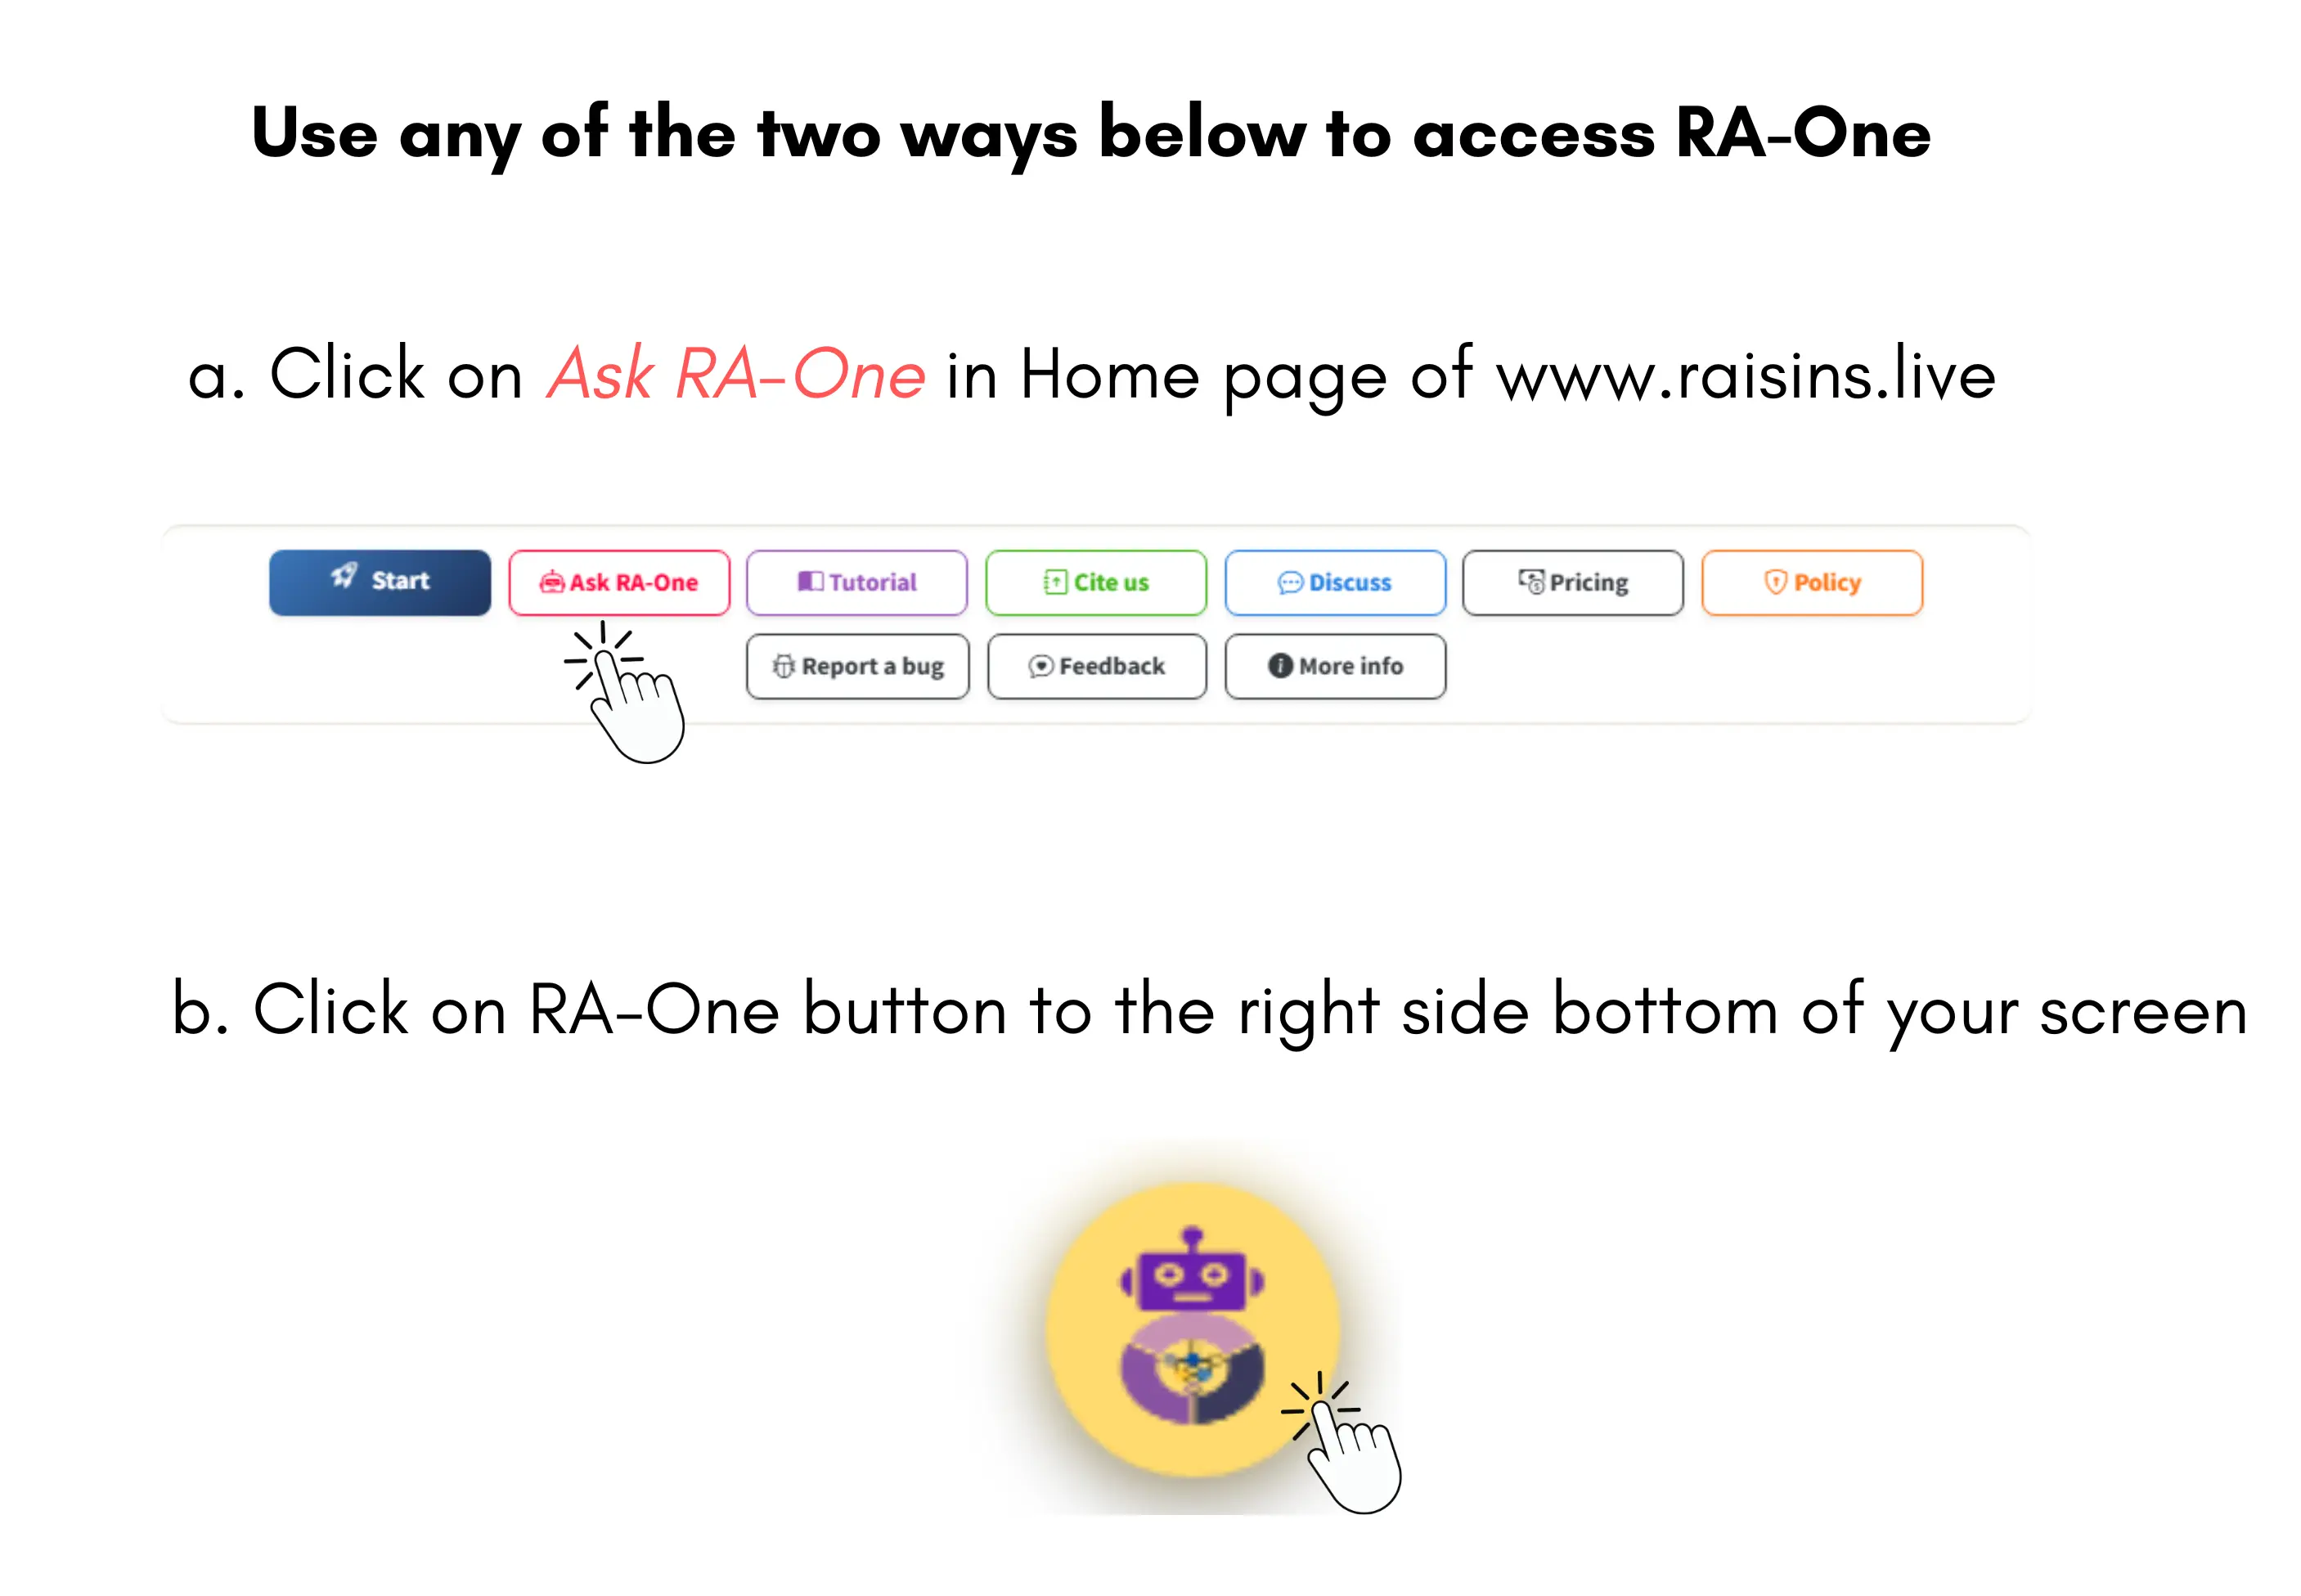
- Ask our AI Statistician, RA-One (RAISINS Assistant One): a free, intelligent assistant that helps you choose the right analysis and guides you through each step. See the instructions for accessing RA-One here 👉 Section 8
- Join our Discussion Corner: if you have a GitHub account, you can post your queries and interact with the RAISINS team and other users in an open, collaborative forum.
- Email us directly at support@statoberry.com: our team will respond personally and help you with your analysis-related questions. In this option we will get back to you in a maximum of 3 working days.
How each module works!
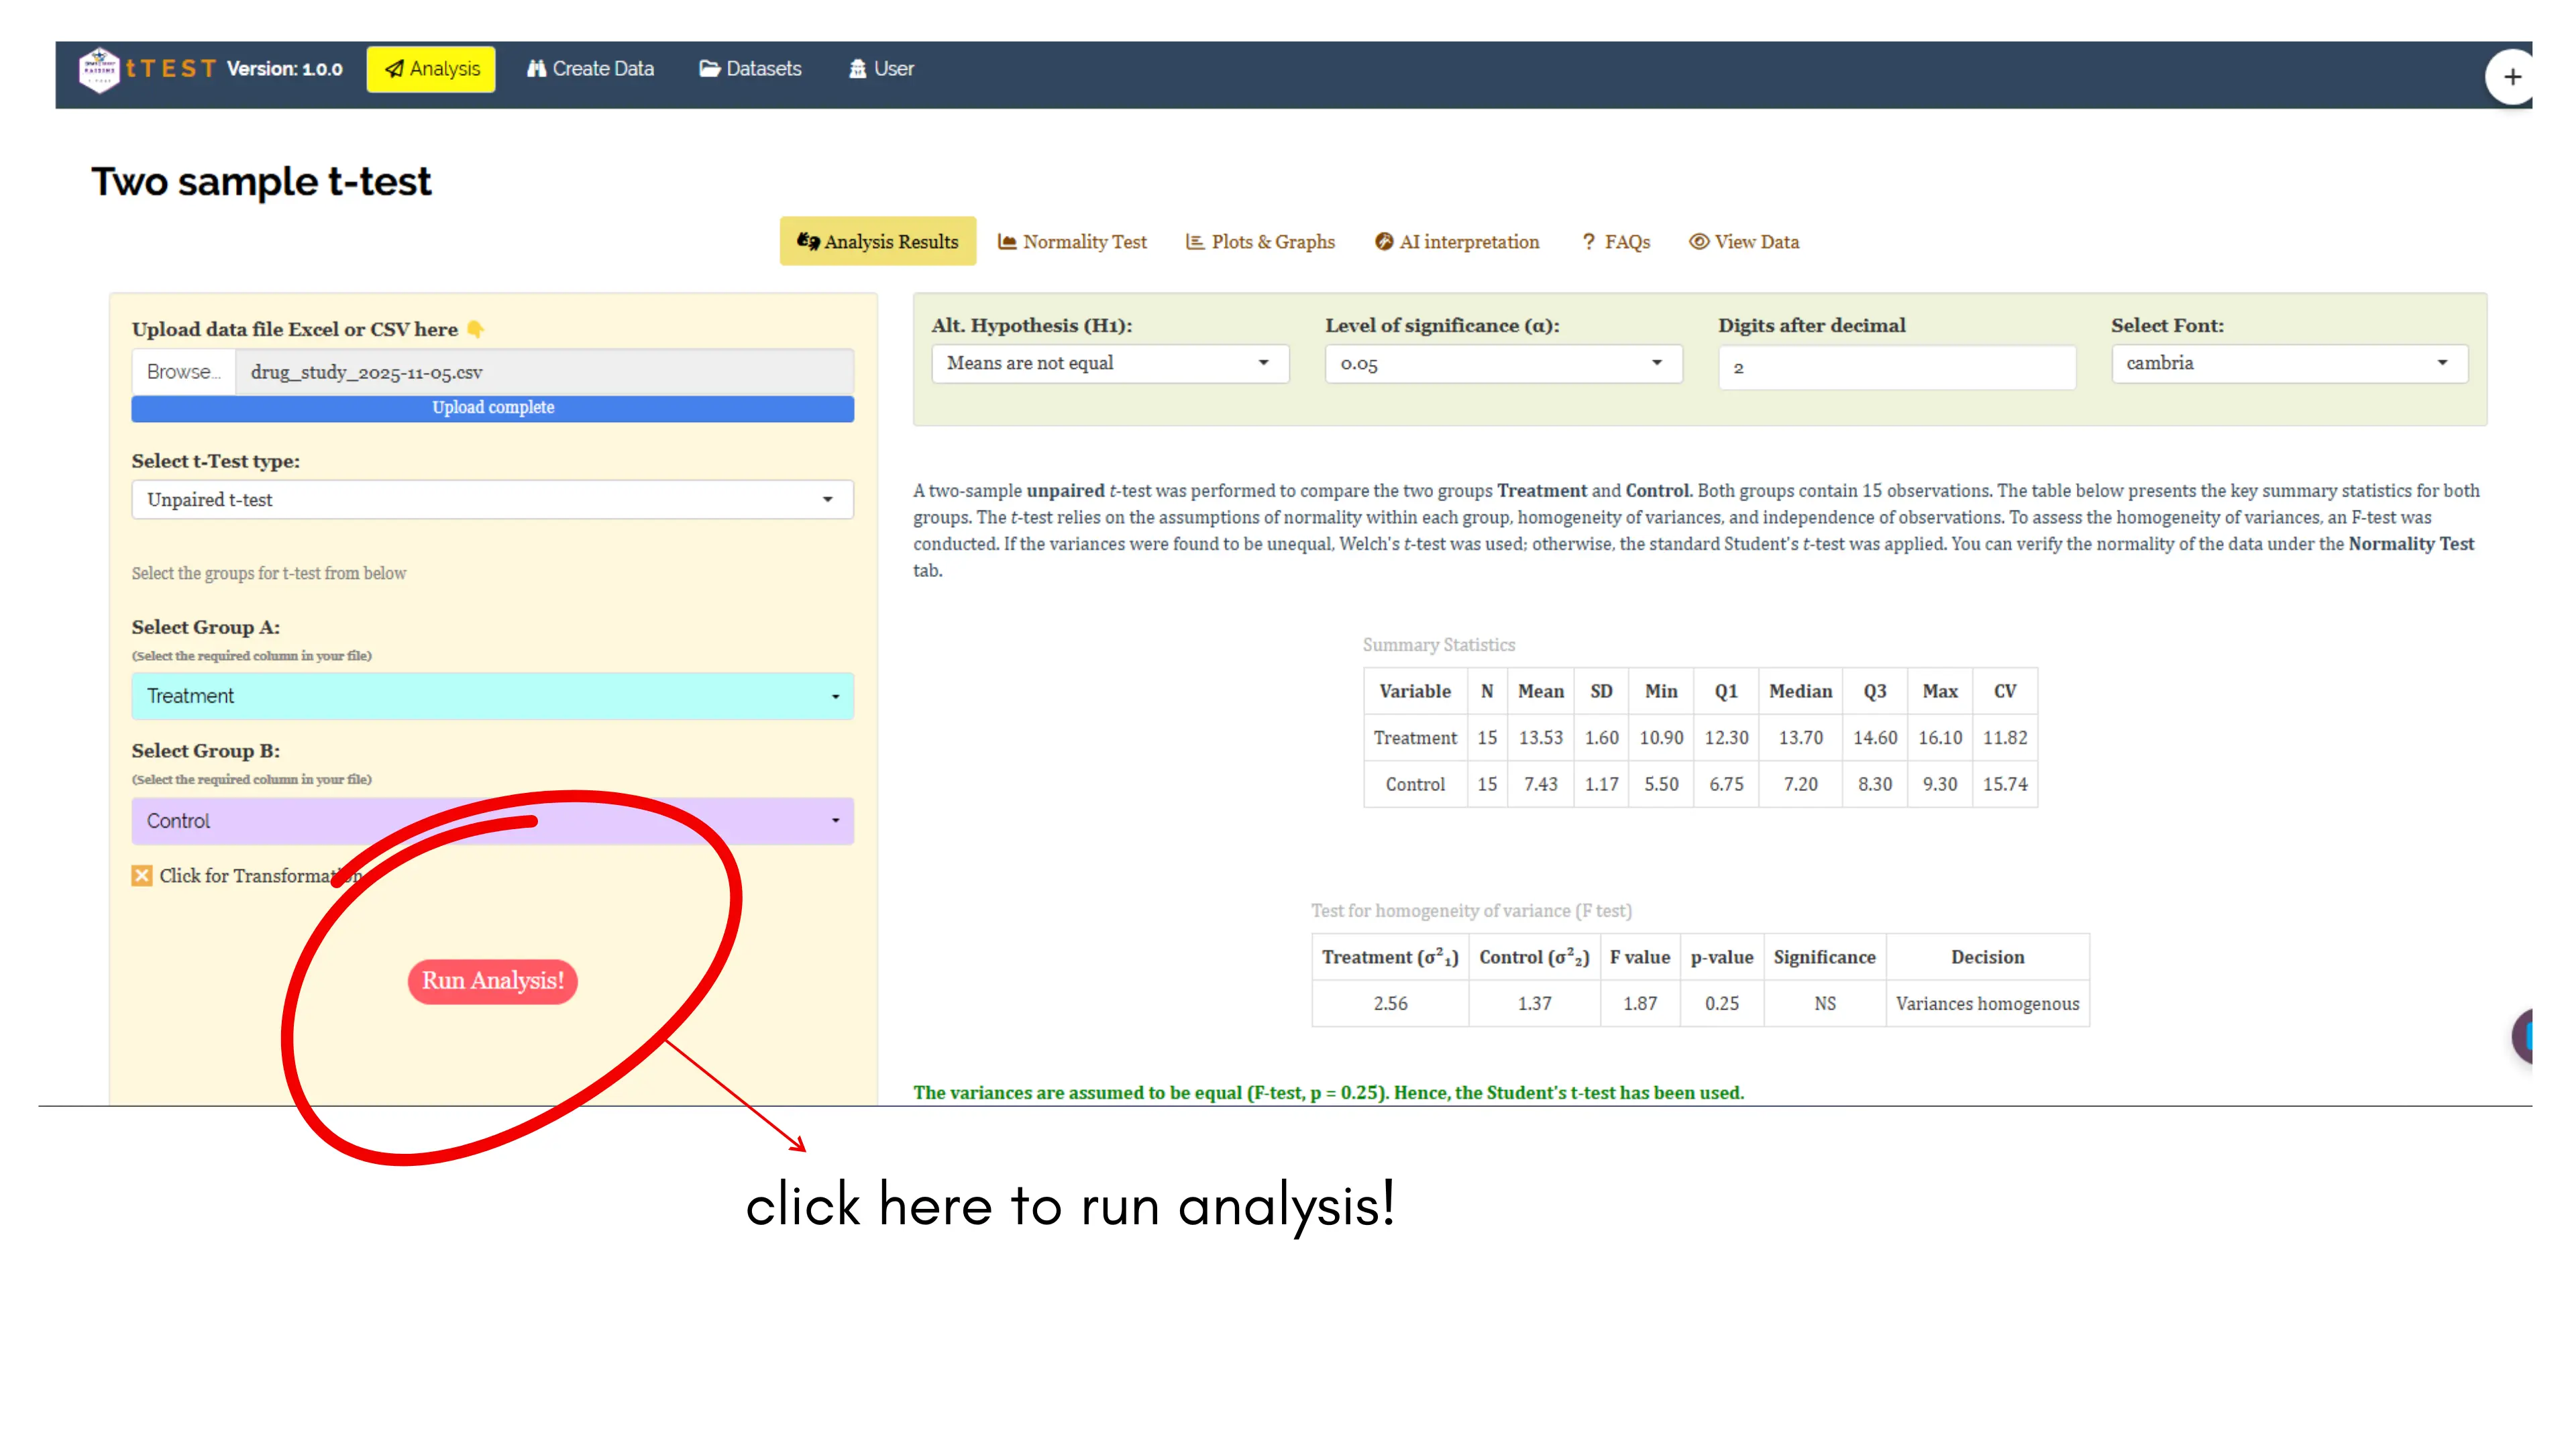
The workflow of all modules or applications within RAISINS follows a uniform and intuitive pattern. This consistency is intentional as it ensures that users can move between different tools with ease and without confusion. The process is straightforward:
Arrange your data file in the prescribed format (see Section 4).
Click Browse and upload your dataset.
Click
Run Analysisand RAISINS will handle the rest!
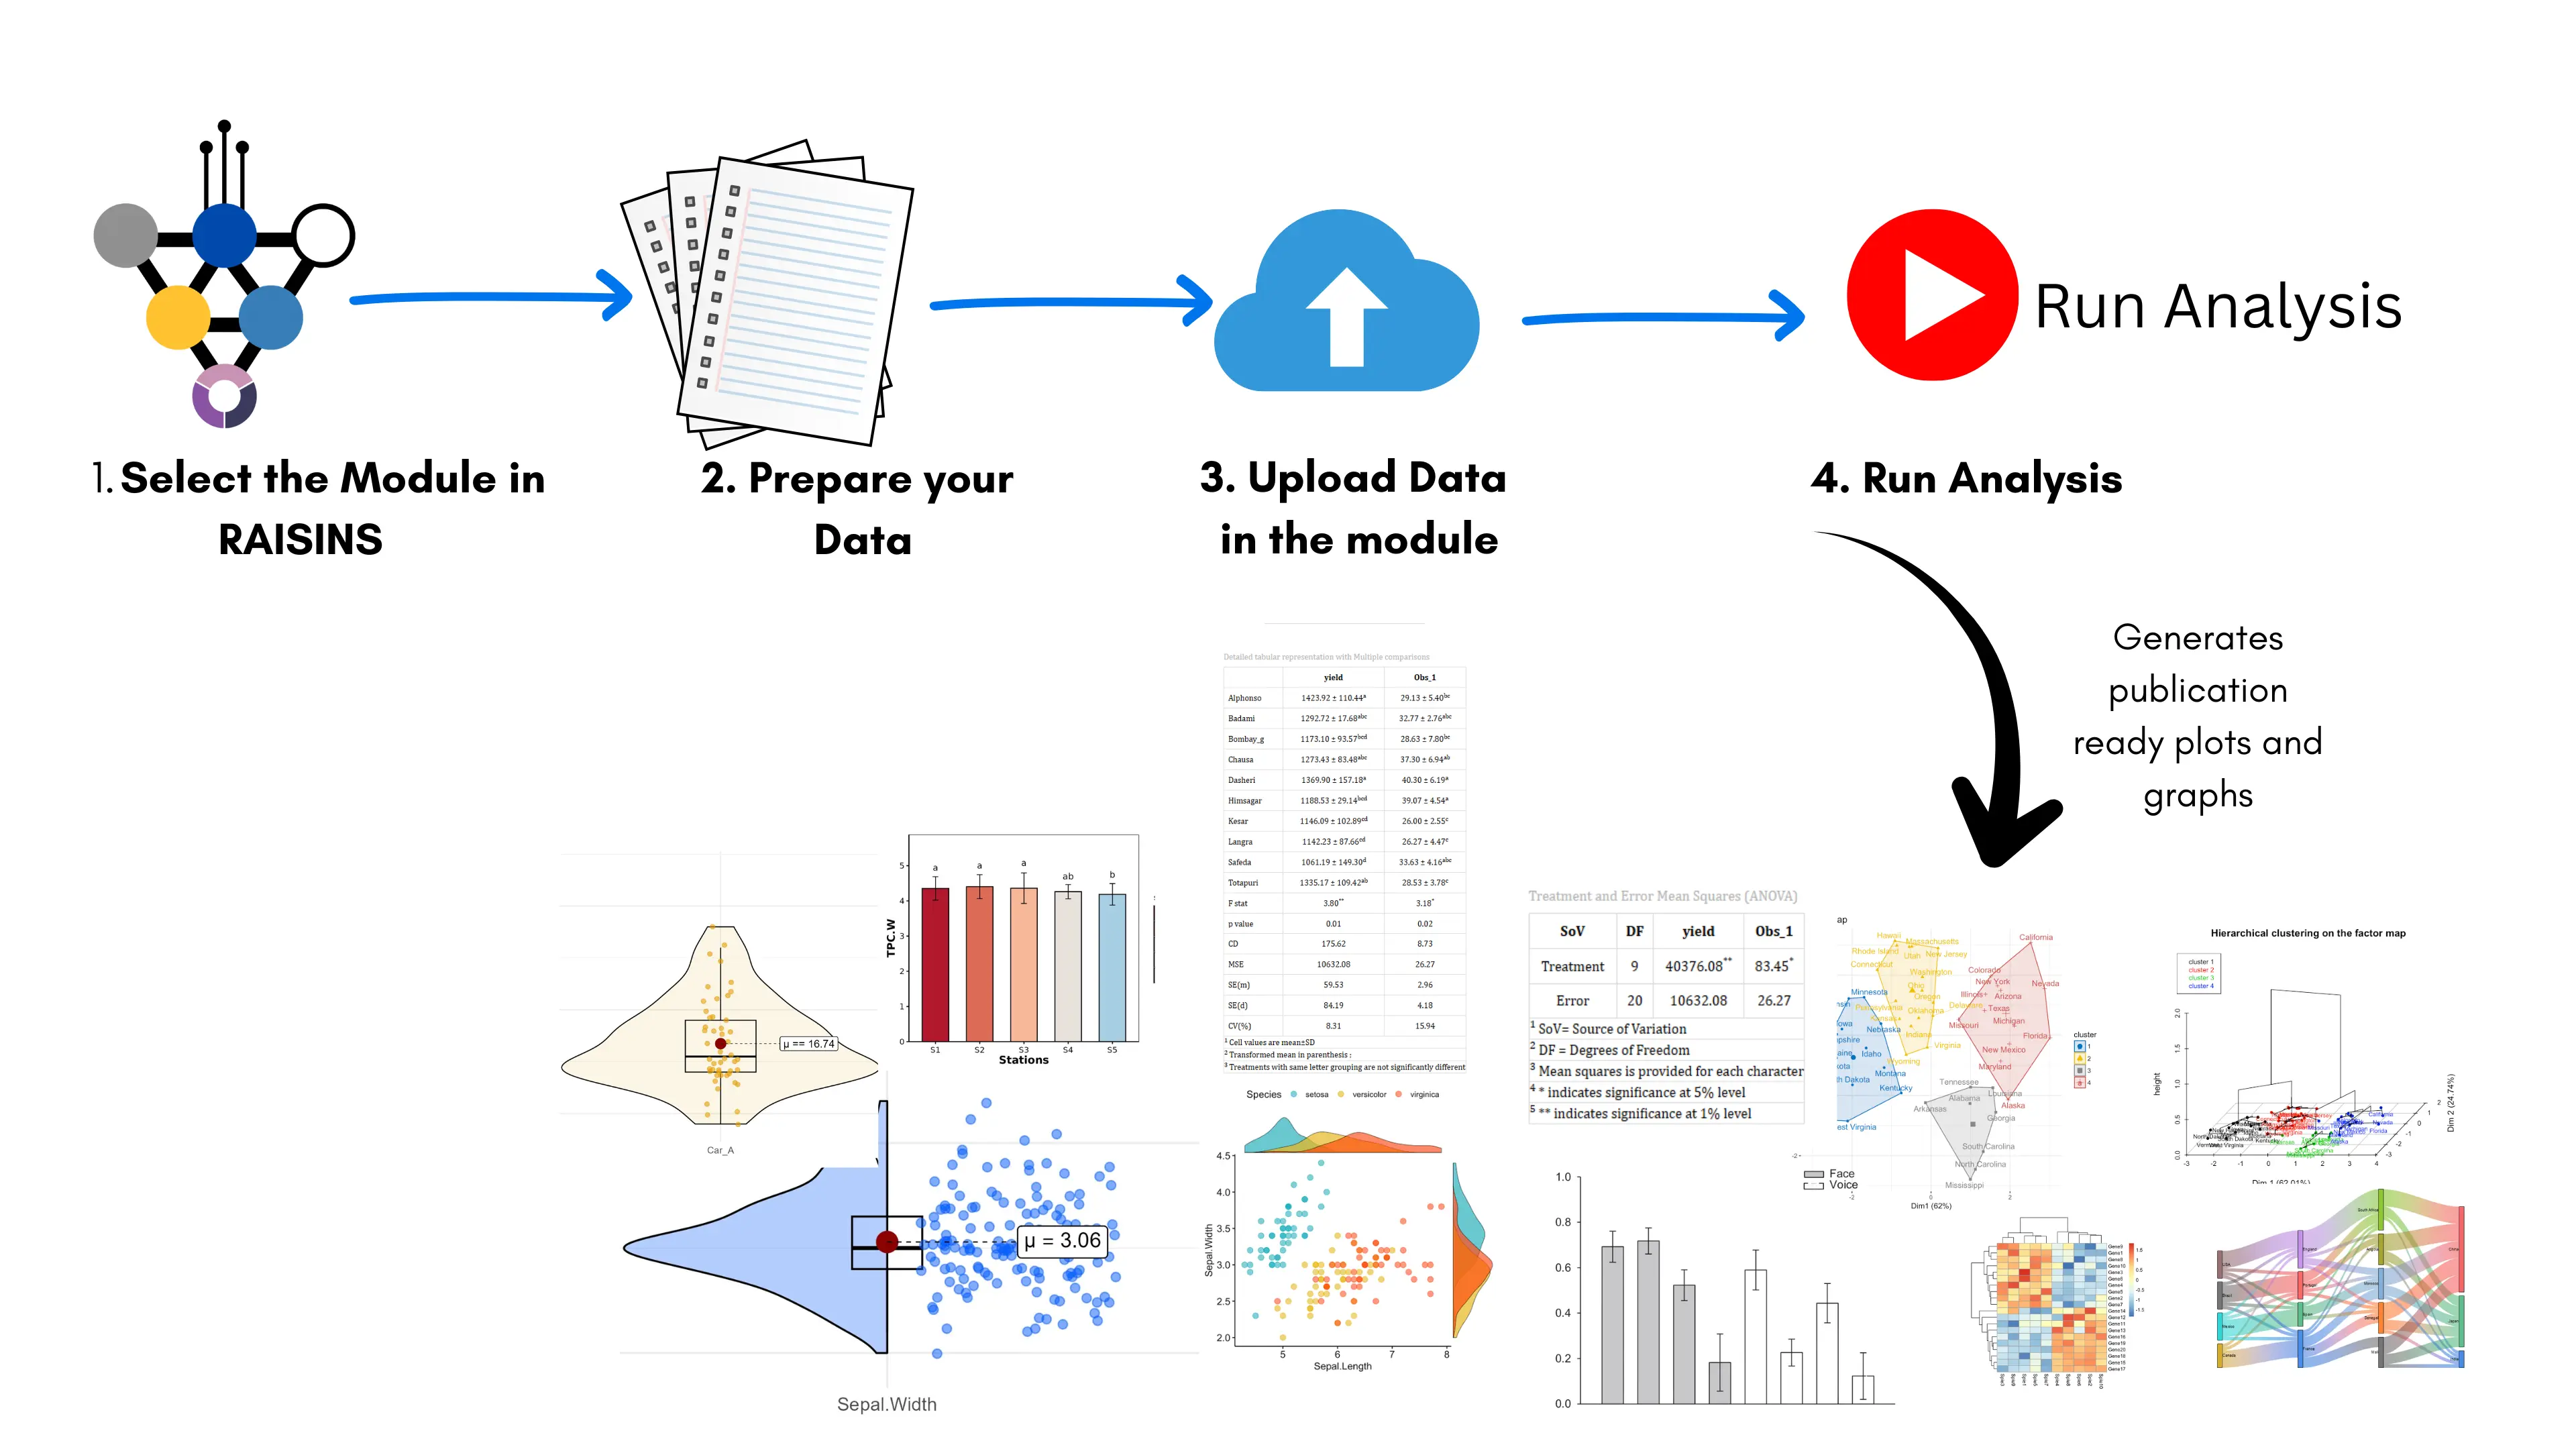
A sample module(application) window is shown in Figure 4 and Figure 5.
Four main tabs
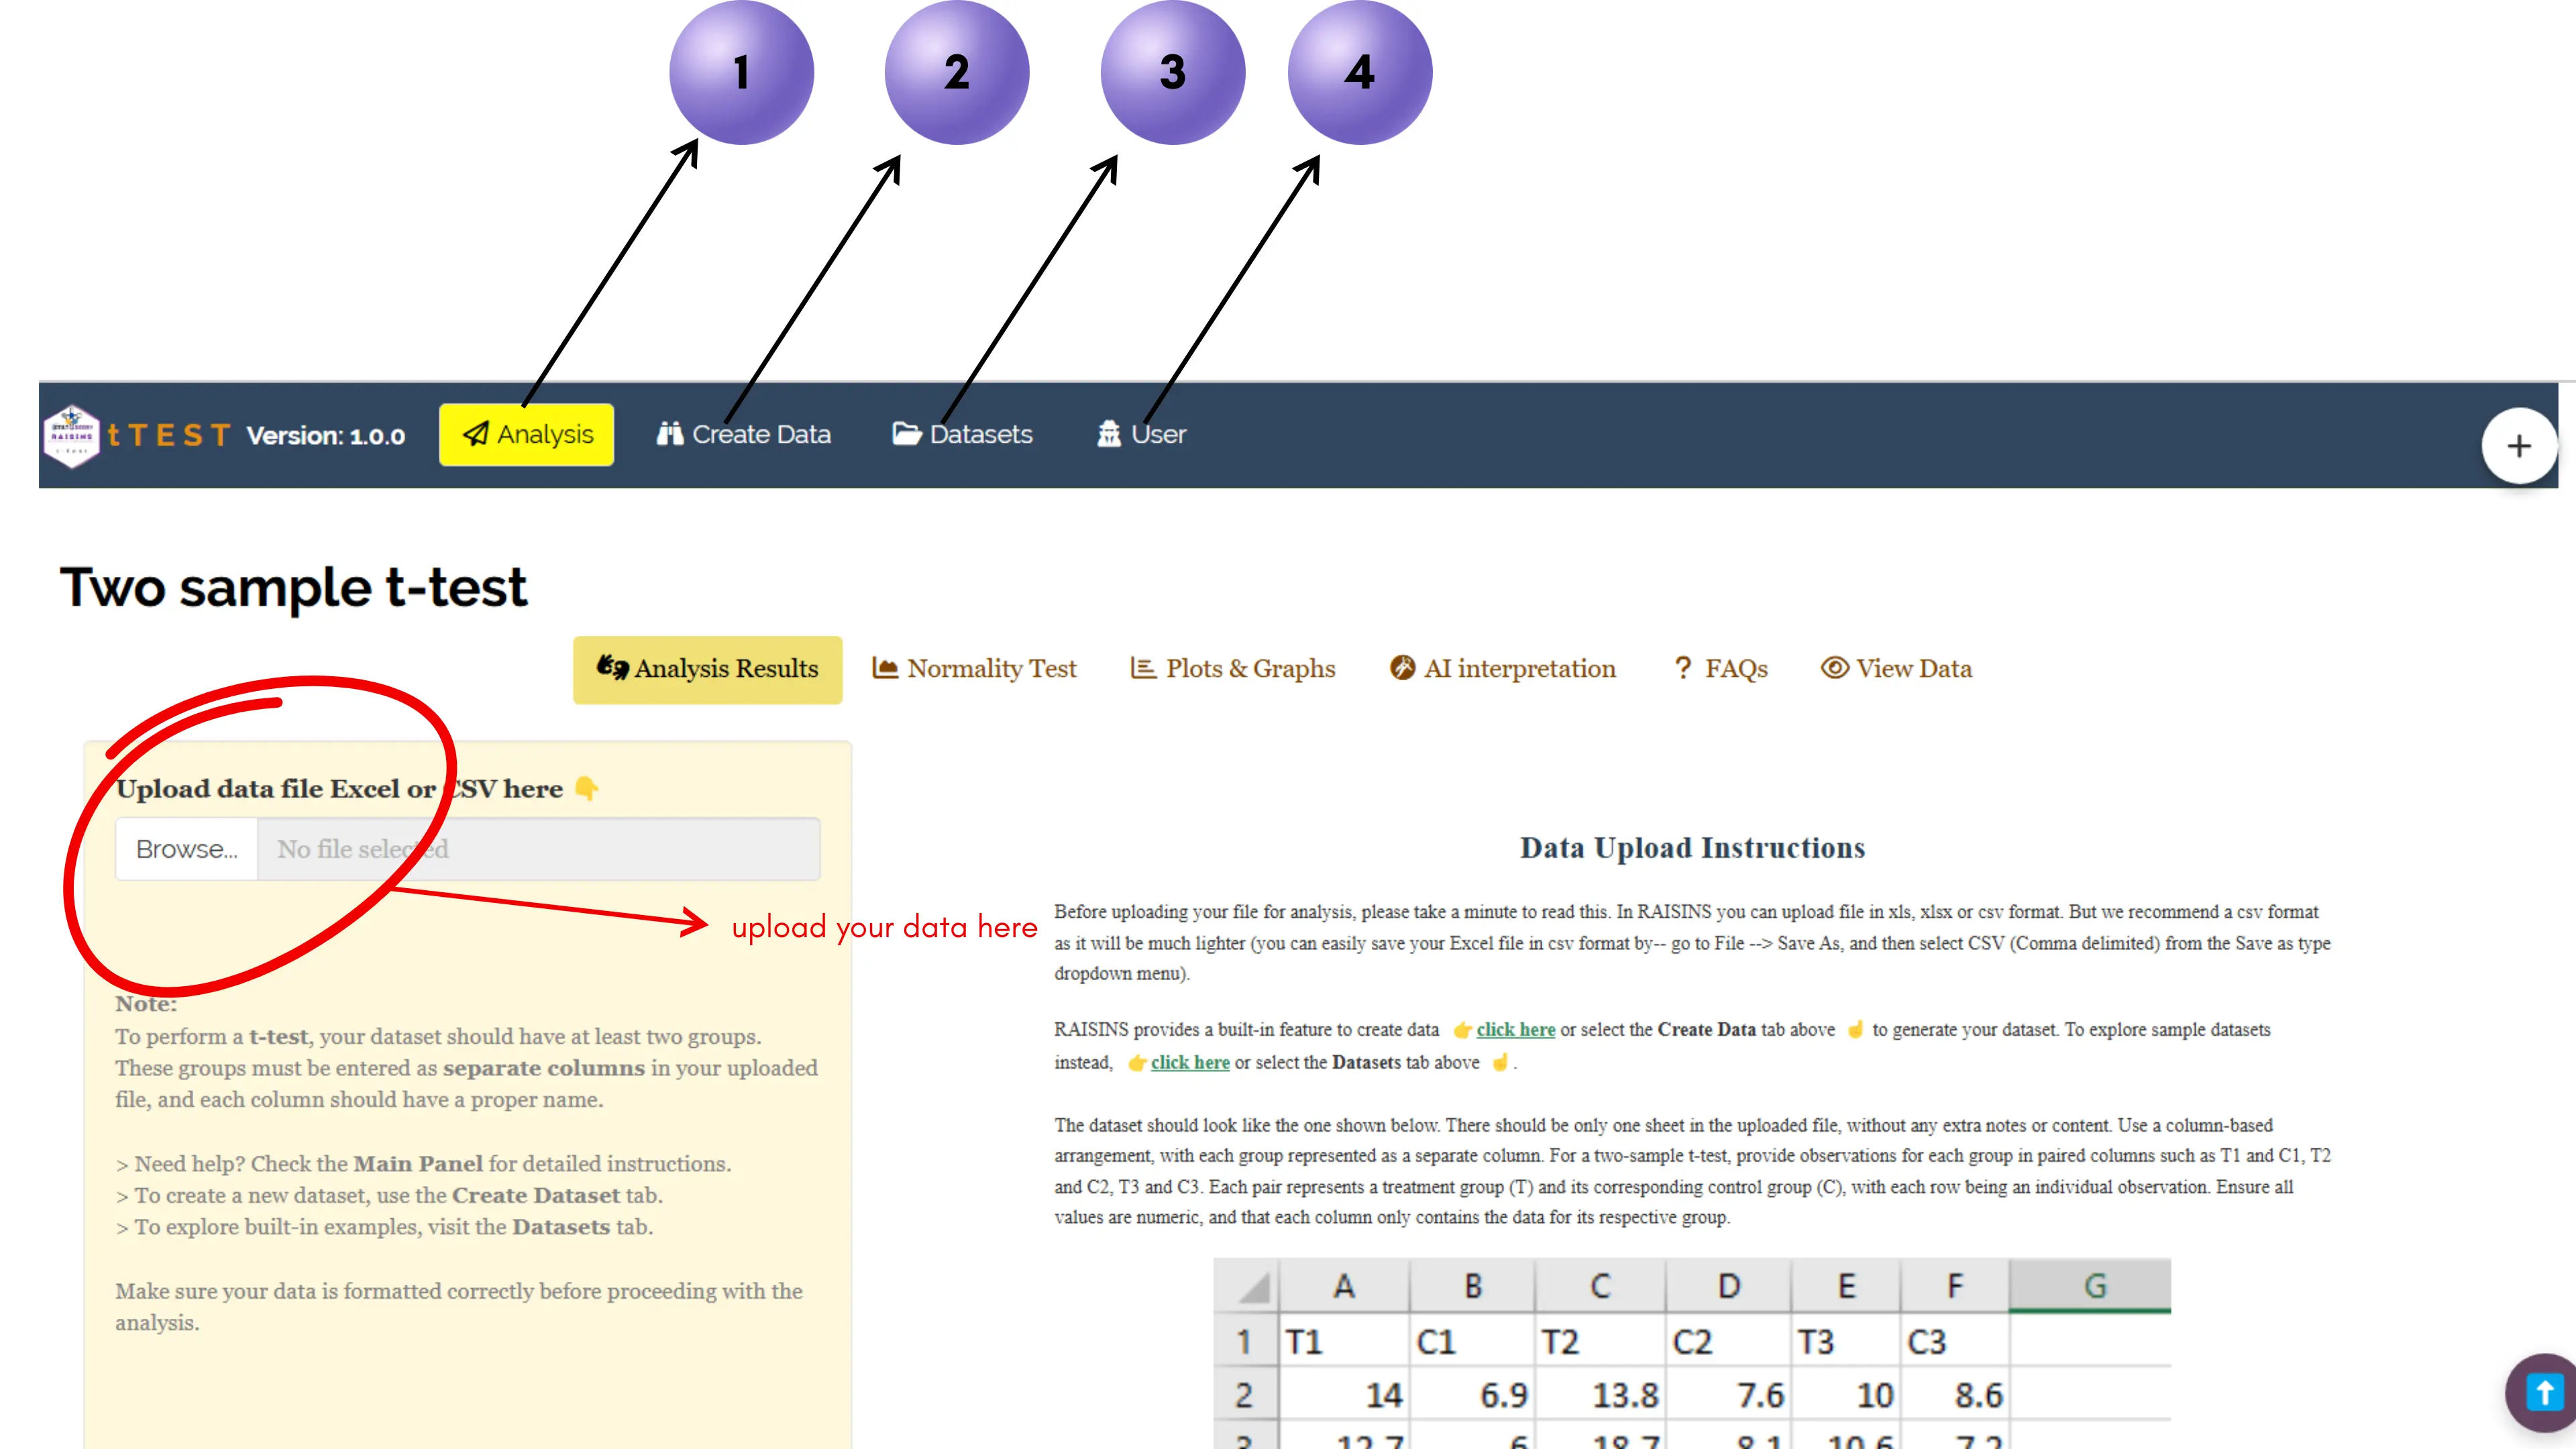
From Figure 4, you can see how an application in RAISINS appears. Every application follows a similar structure with four main tabs, each serving a distinct purpose. The four tabs are:
1 Analysis:
This is the main workspace where the analysis is performed. You can upload your data file here, select the required variables or columns, and click Run Analysis to instantly view the results.
2 Create Data:
This tab allows you to generate the required data format by providing the specified parameters. You can download the file in .xlsx or .csv format and use it for analysis. This feature is especially helpful if you’re unsure about the correct data structure.
3 Datasets:
Each module includes built-in model datasets that you can use for testing. You can also download these datasets to understand how your own data should be arranged before uploading.
4 User:
This tab provides details about your subscription and usage statistics. You can also view or download invoices related to your RAISINS access here.
All modules in RAISINS follow a similar workflow. Just upload your file in the prescribed format and click Run Analysis, as shown in Figure 5.
👉 You only need to be careful while arranging your data. You can refer to the model datasets in Datasets tab of each application or use the Create Data tab.
See Section 4 for key points to remember when preparing your file for upload.
Preparing your file
In RAISINS you can upload file in xls, xlsx or csv format. But we recommend a csv format as it will be much lighter.
Preparing your data
You can create a file for upload in two simple ways:
- Microsoft Excel (.xlsx): create a single sheet with a clear header row and save as
.xlsxor export to.csv.
- Create data (recommended for beginners): inside each RAISINS module, open the Create data tab and enter the requested inputs in the sidebar.
Example: In the CRD module, provide the number of treatments, replications, and characters. RAISINS will generate a ready-to-fill.csvtemplate that you can download, enter values, and upload for analysis.
Detailed instructions on how to prepare data files are given inside each module and also in its corresponding tutorial. If you’re unsure about the required structure, download a model dataset from the Datasets tab in that module and mirror its layout.
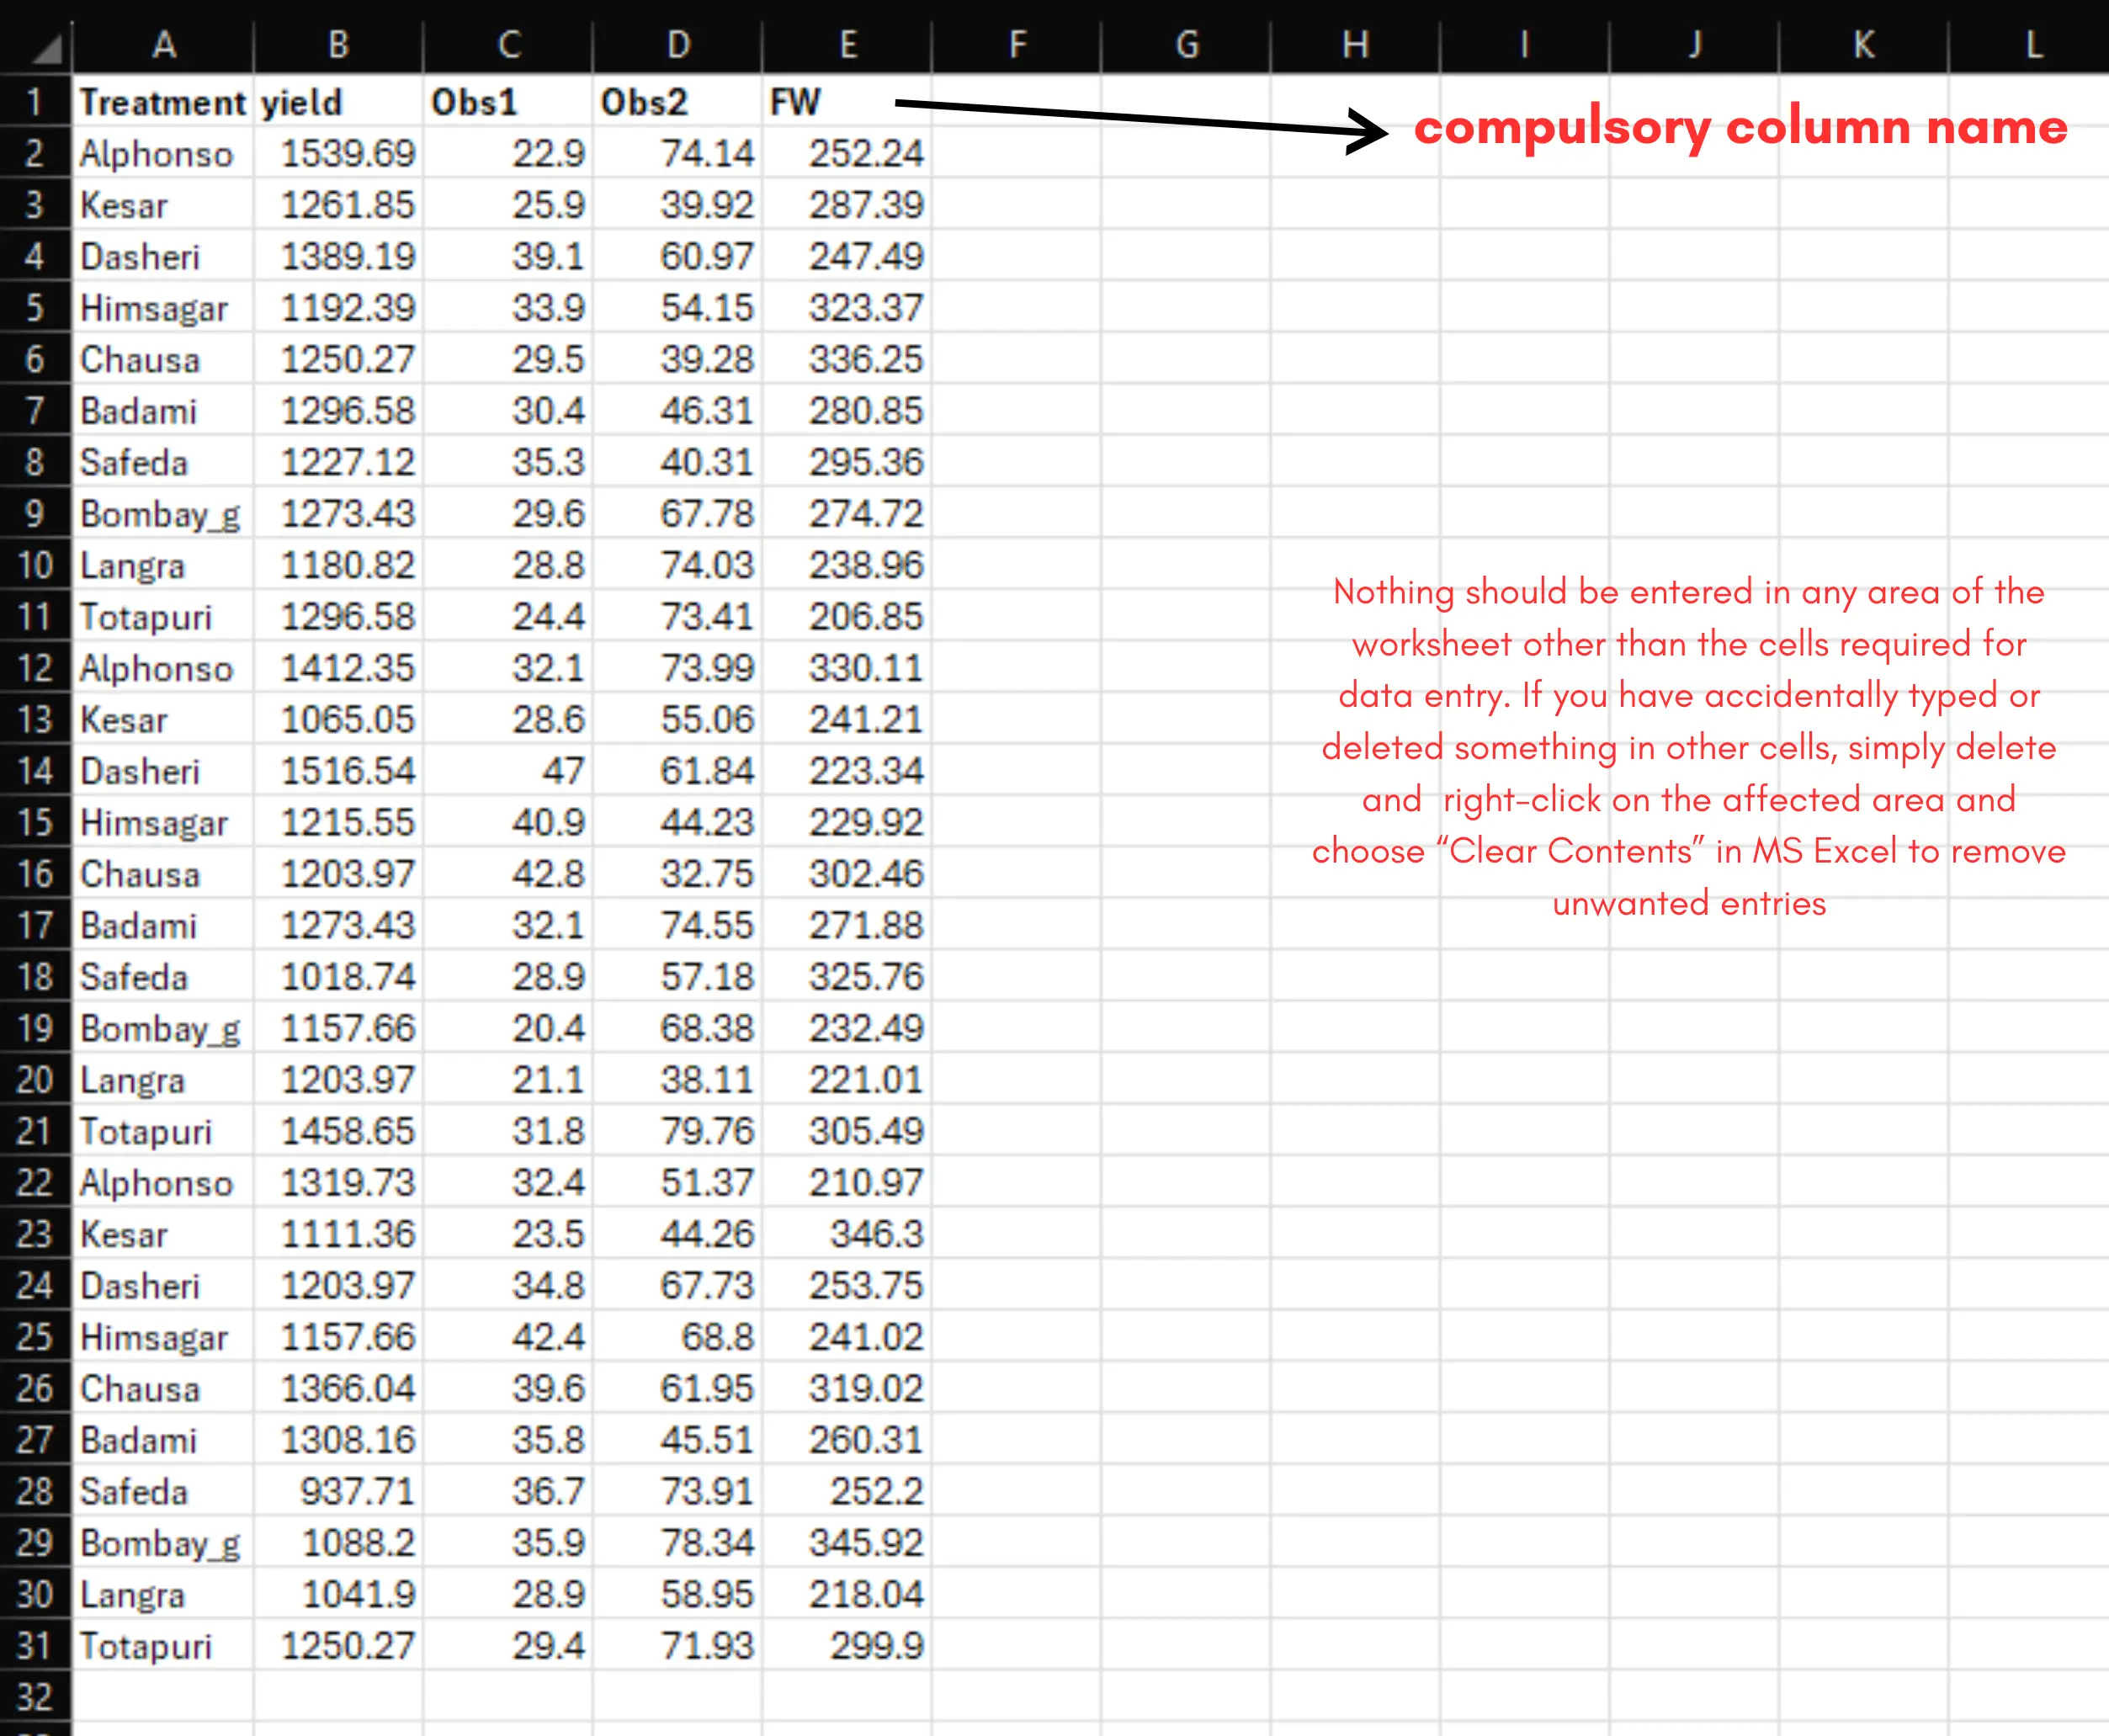
Rules to follow
- Use a single header row with clean column names.
- Data should begin in cell A1, with no blank rows above the header.
- One variable per column, one record per row.
- Save as .csv or .xlsx (both supported).
Column naming: do’s and don’ts
| ✅ Do | ❌ Don’t | 💡 Why |
|---|---|---|
Use short, clear names: yield, treatment, rep |
Long or vague names: this_is_my_final_corrected_yield_value |
Short names read better in tables and plots |
Separate words with _ or .: plant_height |
Use spaces: plant height |
Spaces can break code and labels |
Use letters first: r1_yield |
Start with a number: 1yield |
Column names shouldn’t start with digits |
Avoid symbols: perc_mortality |
Use symbols: percentage mortality (%) |
Symbols like %, # cause parsing issues |
A few column name examples to note
percentage mortality (%)→perc_mortality
Plant height (cm)→plant_height_cm
T1 Yield→t1_yield
Minimal CSV example
Preview login
This is an excellent feature we have introduced in RAISINS. It allows anyone to freely explore any module without registration, promoting open access and enabling global peer review, thereby enhancing transparency and credibility.
When you click on a module,in the login window that opens up- simply select the Preview Mode button as shown in Figure 3. In Figure 7, you can see how to access the preview mode using an OTP. As illustrated in Figure 7 (a), if you already generated an OTP in another module, note that it refreshes only at 12 a.m. and 12 p.m. each day. In such cases, you can use the button I Already Have OTP to proceed. Which will take you to the screen shown in Figure 7 (b), where you have to enter the OTP and get inside the app.
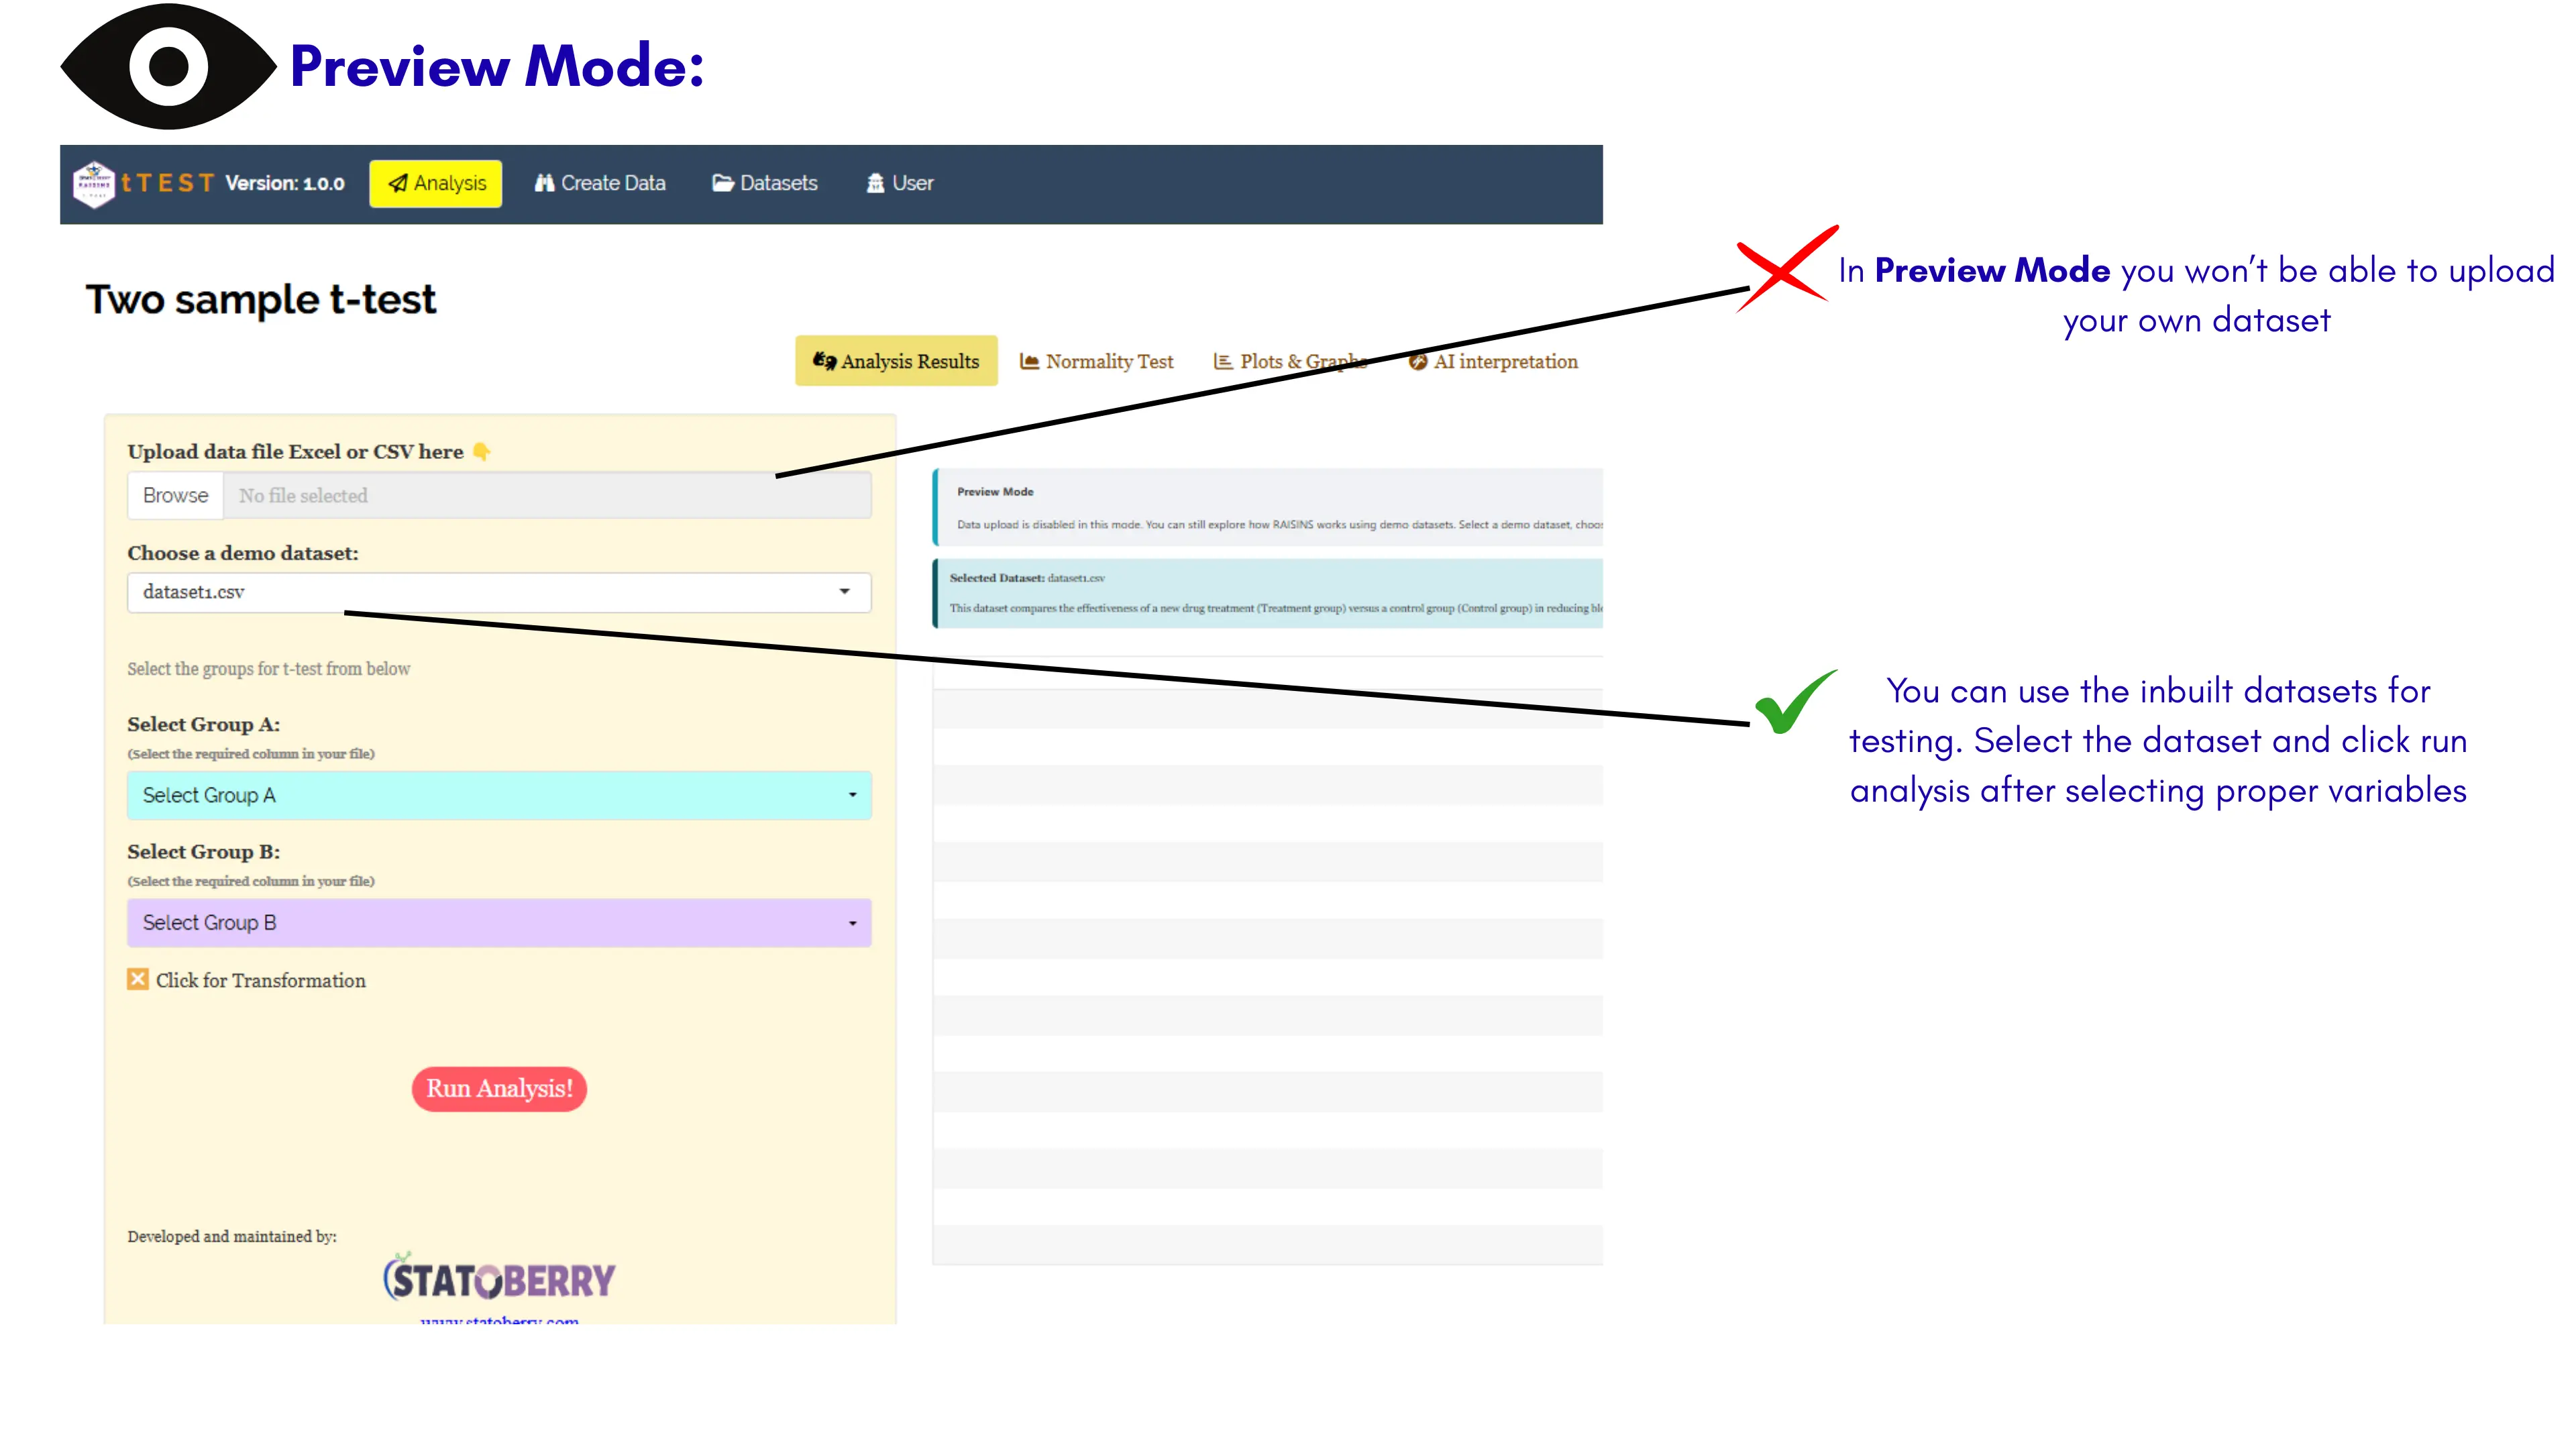
Once inside the app, you can explore all the available features, analyses, and plots using the inbuilt datasets. This allows you to fully experience how each module functions. However, please note that uploading your own dataset is not permitted in preview mode. A sample view of the preview mode interface is shown in Figure 8.
Institutional login
This login feature is available to users who have subscribed to all RAISINS modules through the Individual Plan (unlimited plan), any customized plan, or whose institution is registered with us. You can access any module or only those modules included in your plan by clicking the Institutional Login button in the login window of the selected module, as shown in Figure 3.
An OTP will be sent to your registered email address for authentication. Similar to the preview mode, all OTPs are refreshed only at 12 a.m. and 12 p.m., allowing you to reuse the same OTP for logging into other modules within that time frame.
You can view the available subscription plans for RAISINS here
Module login
RAISINS allows users to access each module independently through subscribing that particular module only. A feature designed with students in mind. If you have subscribed to a single module, you can start using it directly by clicking the Get Started button, as shown in Figure 3.
AI Assistant (RA-One)
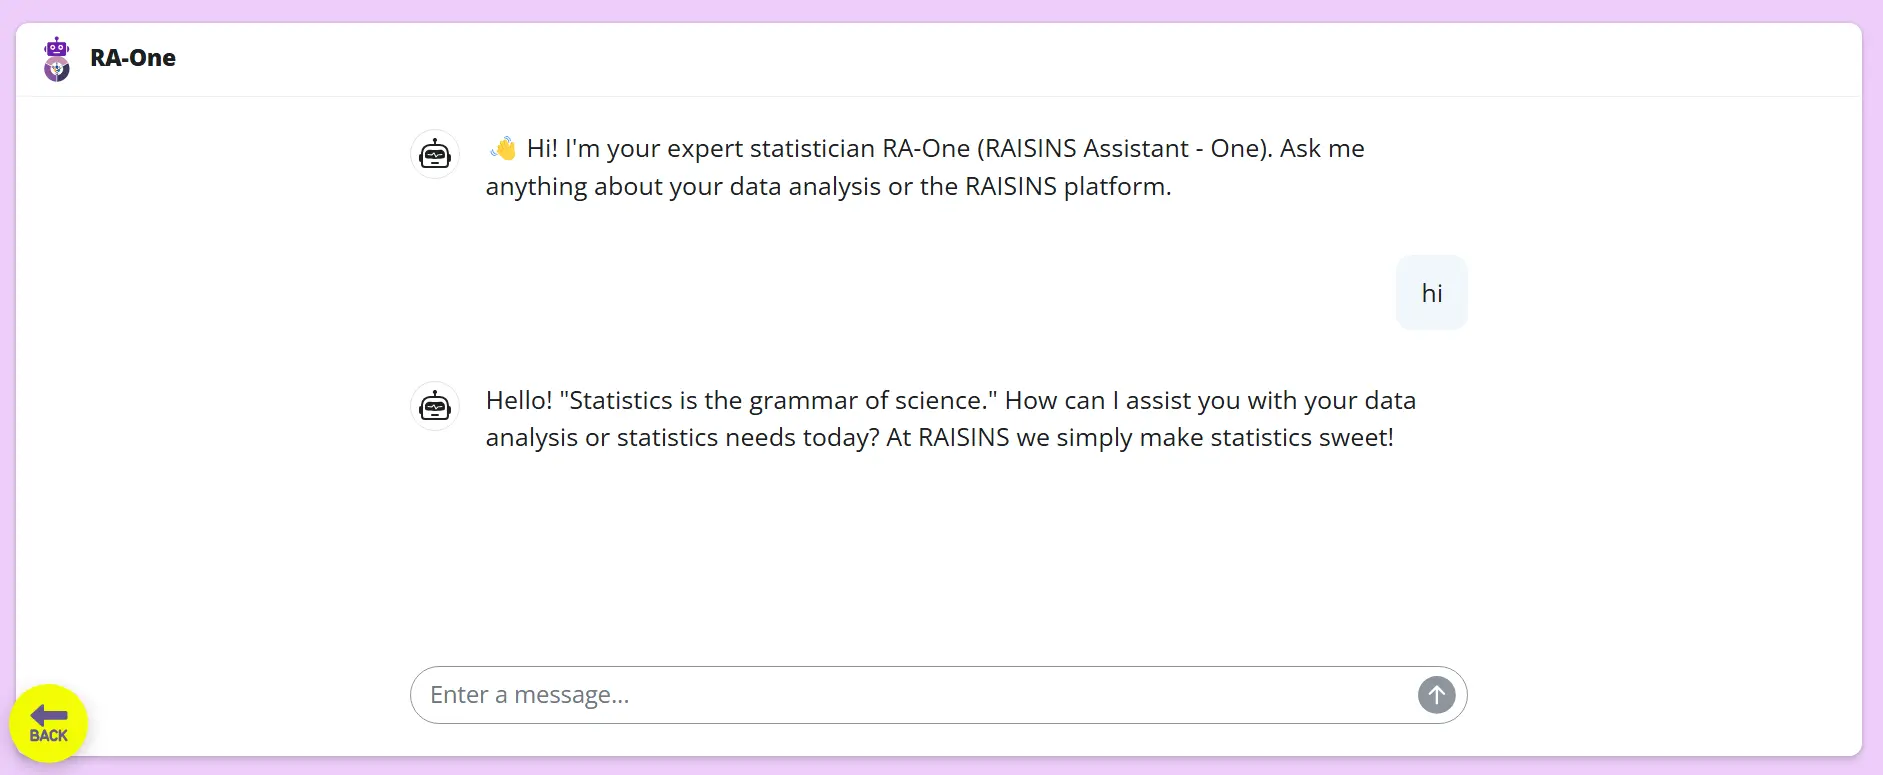
RAISINS features a 24 × 7 AI statistical assistant named RAISINS Assistant-One (RA-One), which is freely accessible to all users. Powered by GPT-4.5 Turbo and further enhanced through Retrieval-Augmented Generation (RAG), RA-One functions like a trained master’s-level statistician. He can clarify your statistical doubts, guide your analysis, and even recommend the most suitable RAISINS module or tool for your dataset.
Data privacy
At RAISINS, data privacy and security are of utmost importance. We do not store or retain any data that users upload for analysis. Each session in RAISINS runs on a temporary cloud instance, meaning that all uploaded data, results, and computations exist only for the duration of your active session. Once you log out, the instance is automatically terminated, and all associated data is permanently deleted. This ensures complete confidentiality and eliminates any risk of unauthorized access.
we recommend that you download your analysis results, plots, and graphs immediately after completing your analysis session as we don’t store anything.
Issues and support
We are always here to help you with any data-related queries or issues you may face while using RAISINS. You can reach us directly through the contact us in RAISINS website or by emailing us at support@statoberry.com.
If you encounter any bugs, you can also report them directly through our GitHub repository using the “Report a Bug” button available on the homepage (for users with a GitHub account) or notify us by mail.
We usually respond within one hour during office hours (Monday to Friday) to any issue raised. You can also contact us via WhatsApp using the number provided on our contact us page.
During holidays, our response time might be a bit longer but we’ll still do our best to get back to you as soon as possible.
Multiple access control
Please note that, for your security, RAISINS does not allow simultaneous access from multiple devices using the same account. If your account is detected as being used on more than one device at the same time, the system will automatically identify it and send a notification alert. So please keep your credentials safe.
Conclusion
RAISINS was born from an academic vision: a collective effort mentored by Department of Agricultural Statistics, College of to democratize statistics. It stands not as a commercial product, but as a bridge connecting knowledge with practice, empowering every researcher to analyze, interpret, and share data with confidence.
We are with you at every step of your research journey- guiding, supporting, and growing together with the community we serve. Through our academic outreach, RAISINS proudly supports the open-access journal Journal of Sustainable Technology in Agriculture (JOSTA), which remains free of article processing charges (APC), ensuring that knowledge stays open and accessible to all.
In the same spirit, RAISINS also sustains the cloud infrastructure of GRAPES, allowing students and researchers continued free access to powerful statistical learning tools. Together, we strive to make research simpler, transparent, and inclusive for a future where statistics belongs to everyone.